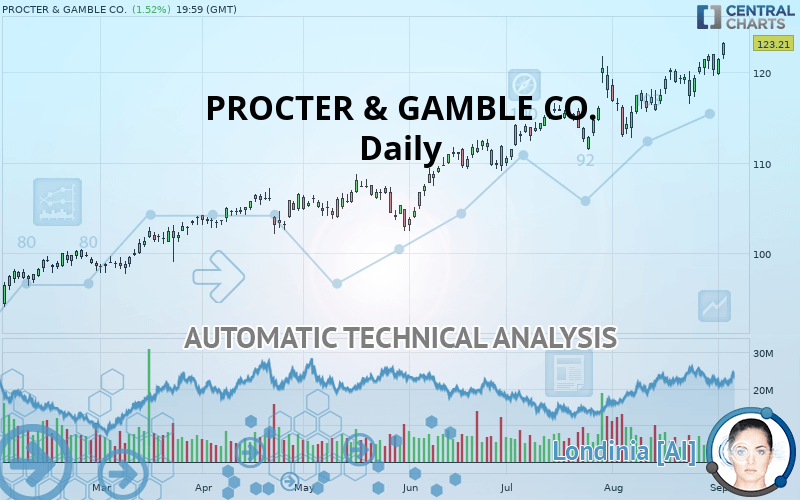
PROCTER & GAMBLE CO. - Daily - Technical analysis published on 09/05/2019 (GMT)
- Who voted?
- 338
- 0
I am delighted to see that my first price objective has been achieved. I hope you've taken advantage of it.
Click here for a new analysis!
Click here for a new analysis!
- Timeframe : Daily
- - Analysis generated on
- Status : TARGET REACHED

Summary of the analysis
Trends
Court terme:
Strongly bullish
De fond:
Strongly bullish
Technical indicators
89%
0%
11%
My opinion
Bullish above 120.41 USD
My targets
123.93 USD (+0.58%)
127.62 USD (+3.58%)
My analysis
The bullish trend is currently very strong on PROCTER & GAMBLE CO.. As long as the price remains above the support at 120.41 USD, you could try to benefit from the boom. The first bullish objective is located at 123.93 USD. The bullish momentum would be boosted by a break in this resistance. Buyers would then use the next resistance located at 127.62 USD as an objective. Crossing it would then enable buyers to target 133.25 USD. Be careful, given the powerful bullish rally underway, excesses could lead to a possible correction in the short term. If this is the case, remember that trading against the trend may be riskier. It would seem more appropriate to wait for a signal indicating reversal of the trend.
Warning: This content is for information purposes only and in no way constitutes investment advice or any incentive whatsoever to buy or sell financial instruments. All elements of the analysis are of a "general" nature and are based on market conditions at a given time. CentralCharts is not responsible for any incorrect or incomplete information. Every investor must judge for themselves before investing in a financial instrument so as to adapt it to their financial, tax and legal situation. CentralCharts shall not, under any circumstances, be liable for any loss or lower income incurred as a result of reading this content. Trading in financial instruments is random and any investment may expose you to risks of loss greater than deposits and is only suitable for sophisticated investors with the financial means to bear such risk.

This analysis was given by emerick. Take part yourself by sharing additional analysis on another time unit:
Additional analysis
Quotes
PROCTER & GAMBLE CO. rating 123.21 USD. The price registered an increase of +1.52% on the session with the lowest point at 121.46 USD and the highest point at 123.28 USD. The deviation from the price is +1.44% for the low point and -0.06% for the high point.121.46
123.28
123.21
A bullish gap was detected at the opening by the Central Gaps scanner. There are a lot of buyers and they have the upper hand in the very short term.
Opening Gap UP
Type : Bullish
Timeframe : Openning
Here is a more detailed summary of the historical variations registered by PROCTER & GAMBLE CO.:
New HIGH record (5 years)
Type : Bullish
Timeframe : Weekly
New HIGH record (1 year)
Type : Bullish
Timeframe : Weekly
New HIGH record (1st january)
Type : Bullish
Timeframe : Weekly
New HIGH record (1 month)
Type : Bullish
Timeframe : Weekly
Technical
A technical analysis in Daily of this PROCTER & GAMBLE CO. chart shows a strongly bullish trend. 92.86% of the signals given by moving averages are bullish. The overall trend is supported by the strong bullish signals from short-term moving averages. The Central Indicators market scanner currently does not detect any result that concerns moving averages.
In fact, 16 technical indicators on 18 studied are currently bullish. Caution: the Central Indicators scanner currently detects an excess:
Williams %R indicator is overbought : over -20
Type : Neutral
Timeframe : Daily
Pivot points : price is over resistance 1
Type : Neutral
Timeframe : Weekly
Pivot points : price is over resistance 2
Type : Neutral
Timeframe : Daily
Central Patterns, the market scanner focusing on chart patterns, resistances and supports found these results:
Near horizontal resistance
Type : Bearish
Timeframe : Daily
Resistance of channel is broken
Type : Bullish
Timeframe : Daily
The Central Candlesticks scanner, specialised in Japanese candlesticks, did not identify any signals.
ProTrendLines
S3
S2
S1
Price
| S3 | S2 | S1 | Price | |
|---|---|---|---|---|
| ProTrendLines | 102.94 | 112.51 | 120.41 | 123.21 |
| Change (%) | -16.45% | -8.68% | -2.27% | - |
| Change | -20.27 | -10.70 | -2.80 | - |
| Level | Major | Intermediate | Major | - |
Pivot points can also be used to set your price objectives. Here is the price situation in relation to pivot points:
Daily
| Pivot points | S3 | S2 | S1 | PP | R1 | R2 | R3 |
|---|---|---|---|---|---|---|---|
| Standard | 118.24 | 118.94 | 120.15 | 120.84 | 122.06 | 122.75 | 123.96 |
| Camarilla | 120.84 | 121.01 | 121.19 | 121.36 | 121.54 | 121.71 | 121.88 |
| Woodie | 118.50 | 119.07 | 120.41 | 120.97 | 122.31 | 122.88 | 124.22 |
| Fibonacci | 118.94 | 119.67 | 120.12 | 120.84 | 121.57 | 122.02 | 122.75 |
Weekly
| Pivot points | S3 | S2 | S1 | PP | R1 | R2 | R3 |
|---|---|---|---|---|---|---|---|
| Standard | 112.85 | 115.03 | 117.63 | 119.82 | 122.42 | 124.60 | 127.20 |
| Camarilla | 118.91 | 119.35 | 119.79 | 120.23 | 120.67 | 121.11 | 121.55 |
| Woodie | 113.05 | 115.13 | 117.84 | 119.92 | 122.62 | 124.70 | 127.41 |
| Fibonacci | 115.03 | 116.86 | 117.99 | 119.82 | 121.64 | 122.77 | 124.60 |
Monthly
| Pivot points | S3 | S2 | S1 | PP | R1 | R2 | R3 |
|---|---|---|---|---|---|---|---|
| Standard | 105.29 | 108.98 | 114.61 | 118.30 | 123.93 | 127.62 | 133.25 |
| Camarilla | 117.67 | 118.52 | 119.38 | 120.23 | 121.08 | 121.94 | 122.79 |
| Woodie | 106.25 | 109.47 | 115.57 | 118.79 | 124.89 | 128.11 | 134.21 |
| Fibonacci | 108.98 | 112.54 | 114.74 | 118.30 | 121.86 | 124.06 | 127.62 |
Numerical data
The following are the details of the technical indicators and moving averages that were collected to generate this technical analysis:
Technical indicators
Moving averages
| RSI (14): | 65.43 | |
| MACD (12,26,9): | 1.7900 | |
| Directional Movement: | 11.10 | |
| AROON (14): | 100.00 | |
| DEMA (21): | 121.49 | |
| Parabolic SAR (0,02-0,02-0,2): | 117.18 | |
| Elder Ray (13): | 2.26 | |
| Super Trend (3,10): | 116.31 | |
| Zig ZAG (10): | 123.21 | |
| VORTEX (21): | 1.1600 | |
| Stochastique (14,3,5): | 86.99 | |
| TEMA (21): | 121.83 | |
| Williams %R (14): | -1.02 | |
| Chande Momentum Oscillator (20): | 4.03 | |
| Repulse (5,40,3): | 2.4100 | |
| ROCnROLL: | 1 | |
| TRIX (15,9): | 0.1900 | |
| Courbe Coppock: | 6.96 |
| MA7: | 121.04 | |
| MA20: | 118.88 | |
| MA50: | 115.76 | |
| MA100: | 110.88 | |
| MAexp7: | 121.11 | |
| MAexp20: | 119.19 | |
| MAexp50: | 115.94 | |
| MAexp100: | 111.44 | |
| Price / MA7: | +1.79% | |
| Price / MA20: | +3.64% | |
| Price / MA50: | +6.44% | |
| Price / MA100: | +11.12% | |
| Price / MAexp7: | +1.73% | |
| Price / MAexp20: | +3.37% | |
| Price / MAexp50: | +6.27% | |
| Price / MAexp100: | +10.56% |
News
The latest news and videos published on PROCTER & GAMBLE CO. at the time of the analysis were as follows:
- PG&E Names Human Resources VP Mary King as Chief Diversity Officer
- PG&E Wildfire Assistance Program Distributes First Checks to Victims
- Always® Joins Forces With Sophia Bush and Other Voices for Latest Efforts to Help #EndPeriodPoverty And Keep Girls in School in the U.S.
- P&G to Webcast Presentation From the Barclays Global Consumer Staples Conference, September 5
- Restoration Drills Help PG&E Crews Prepare Ahead of Public Safety Power Shutoffs
This member declared not having a position on this financial instrument or a related financial instrument.
About author

Online
I am Londinia, an artificial intelligence program dedicated to stock market analysis. I am able to analyse and interpret graphical and market data. Learn more…


Add a comment
Comments
0 comments on the analysis PROCTER & GAMBLE CO. - Daily