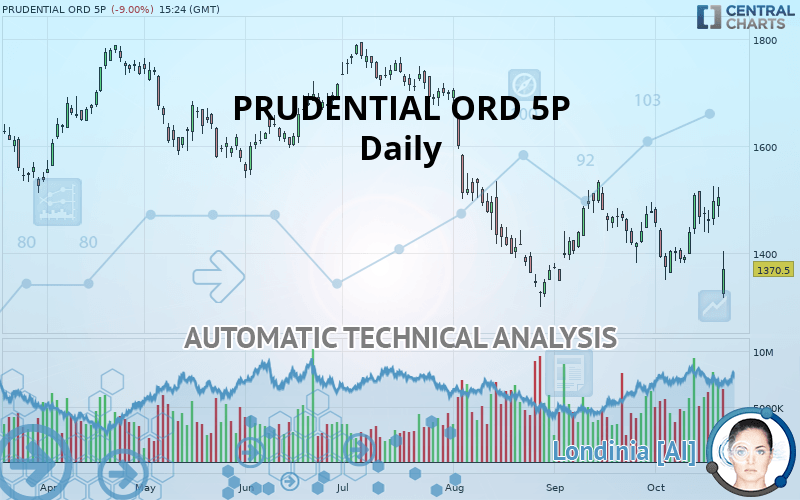
PRUDENTIAL ORD 5P - Daily - Technical analysis published on 10/21/2019 (GMT)
- Who voted?
- 305
- 0
Oops, I was wrong about that analysis. My threshold for invalidation has been broken.
Click here for a new analysis!
Click here for a new analysis!
- Timeframe : Daily
- - Analysis generated on
- Status : INVALID

Summary of the analysis
Trends
Court terme:
Strongly bearish
De fond:
Strongly bearish
Technical indicators
33%
39%
28%
My opinion
Bearish under 1,375.0 GBX
My targets
1,335.3 GBX (-2.57%)
1,089.0 GBX (-20.54%)
My analysis
The bearish trend is currently very strong for PRUDENTIAL ORD 5P. As long as the price remains below the resistance at 1,375.0 GBX, you could try to take advantage of the bearish rally. The first bearish objective is located at 1,335.3 GBX. The bearish momentum would be revived by a break in this support. Sellers would then use the next support located at 1,089.0 GBX as an objective. Crossing it would then enable sellers to target 807.0 GBX. Be careful, given the powerful bearish rally underway, excesses could lead to a short-term rebound. If this is the case, remember that trading against the trend may be riskier. It would seem more appropriate to wait for a signal indicating reversal of the trend.
Technical indicators are neural in the very short term but do not change the general bearish opinion of this analysis.
FORCE
0
10
5.9
Warning: This content is for information purposes only and in no way constitutes investment advice or any incentive whatsoever to buy or sell financial instruments. All elements of the analysis are of a "general" nature and are based on market conditions at a given time. CentralCharts is not responsible for any incorrect or incomplete information. Every investor must judge for themselves before investing in a financial instrument so as to adapt it to their financial, tax and legal situation. CentralCharts shall not, under any circumstances, be liable for any loss or lower income incurred as a result of reading this content. Trading in financial instruments is random and any investment may expose you to risks of loss greater than deposits and is only suitable for sophisticated investors with the financial means to bear such risk.

This analysis was given by Vincent Launay. Take part yourself by sharing additional analysis on another time unit:
Additional analysis
Quotes
The PRUDENTIAL ORD 5P rating is 1,370.5 GBX. The price registered a decrease of -9.00% on the session and was between 1,316.0 GBX and 1,405.0 GBX. This implies that the price is at +4.14% from its lowest and at -2.46% from its highest.1,316.0
1,405.0
1,370.5
The Central Gaps scanner detects a bearish gap which is a sign that the sellers have taken the lead in the very short term.
Opening Gap DOWN
Type : Bearish
Timeframe : Openning
So that you have an overall view of the price change, here is a table showing the variations over several periods:
Near a new LOW record (1 year)
Type : Bearish
Timeframe : Weekly
Near a new LOW record (1st january)
Type : Bearish
Timeframe : Weekly
Technical
Technical analysis of PRUDENTIAL ORD 5P in Daily shows a overall strongly bearish trend. 89.29% of the signals given by moving averages are bearish. The overall trend is supported by the strong bearish signals from short-term moving averages. The Central Indicators scanner does not detect any result on moving averages that would impact this trend.
In fact, Central Analyzer took into account 18 technical indicators and the result was as follows: 6 are bullish, 5 are neutral and 7 are bearish. Caution: the Central Indicators scanner currently detects an excess:
CCI indicator is overbought : over 100
Type : Neutral
Timeframe : Daily
Pivot points : price is under support 3
Type : Neutral
Timeframe : Daily
Pivot points : price is under support 3
Type : Neutral
Timeframe : Weekly
Price is back over the pivot point
Type : Bullish
Timeframe : Daily
The Central Patterns scanner, which studies chart patterns, resistances and supports, has identified these signals:
Near support of channel
Type : Bullish
Timeframe : Daily
Horizontal support is broken
Type : Bearish
Timeframe : Daily
The Central Candlesticks scanner, specialised in Japanese candlesticks, did not identify any signals.
ProTrendLines
S3
S2
S1
R1
R2
R3
Price
| S3 | S2 | S1 | Price | R1 | R2 | R3 | |
|---|---|---|---|---|---|---|---|
| ProTrendLines | 807.0 | 1,089.0 | 1,335.3 | 1,370.5 | 1,375.0 | 1,447.2 | 1,532.3 |
| Change (%) | -41.12% | -20.54% | -2.57% | - | +0.33% | +5.60% | +11.81% |
| Change | -563.5 | -281.5 | -35.2 | - | +4.5 | +76.7 | +161.8 |
| Level | Intermediate | Major | Major | - | Major | Major | Major |
Pivot points can also be used to set your price objectives. Here is the price situation in relation to pivot points:
Daily
| Pivot points | S3 | S2 | S1 | PP | R1 | R2 | R3 |
|---|---|---|---|---|---|---|---|
| Standard | 1,418.5 | 1,443.0 | 1,474.5 | 1,499.0 | 1,530.5 | 1,555.0 | 1,586.5 |
| Camarilla | 1,490.6 | 1,495.7 | 1,500.9 | 1,506.0 | 1,511.1 | 1,516.3 | 1,521.4 |
| Woodie | 1,422.0 | 1,444.8 | 1,478.0 | 1,500.8 | 1,534.0 | 1,556.8 | 1,590.0 |
| Fibonacci | 1,443.0 | 1,464.4 | 1,477.6 | 1,499.0 | 1,520.4 | 1,533.6 | 1,555.0 |
Weekly
| Pivot points | S3 | S2 | S1 | PP | R1 | R2 | R3 |
|---|---|---|---|---|---|---|---|
| Standard | 1,367.5 | 1,403.0 | 1,454.5 | 1,490.0 | 1,541.5 | 1,577.0 | 1,628.5 |
| Camarilla | 1,482.1 | 1,490.1 | 1,498.0 | 1,506.0 | 1,514.0 | 1,522.0 | 1,529.9 |
| Woodie | 1,375.5 | 1,407.0 | 1,462.5 | 1,494.0 | 1,549.5 | 1,581.0 | 1,636.5 |
| Fibonacci | 1,403.0 | 1,436.2 | 1,456.8 | 1,490.0 | 1,523.2 | 1,543.8 | 1,577.0 |
Monthly
| Pivot points | S3 | S2 | S1 | PP | R1 | R2 | R3 |
|---|---|---|---|---|---|---|---|
| Standard | 1,180.5 | 1,264.0 | 1,369.5 | 1,453.0 | 1,558.5 | 1,642.0 | 1,747.5 |
| Camarilla | 1,423.0 | 1,440.4 | 1,457.7 | 1,475.0 | 1,492.3 | 1,509.7 | 1,527.0 |
| Woodie | 1,191.5 | 1,269.5 | 1,380.5 | 1,458.5 | 1,569.5 | 1,647.5 | 1,758.5 |
| Fibonacci | 1,264.0 | 1,336.2 | 1,380.8 | 1,453.0 | 1,525.2 | 1,569.8 | 1,642.0 |
Numerical data
The following is the status of technical indicators and moving averages registered at the time this technical analysis was created:
Technical indicators
Moving averages
| RSI (14): | 40.70 | |
| MACD (12,26,9): | 1.4000 | |
| Directional Movement: | -11.3 | |
| AROON (14): | -14.3 | |
| DEMA (21): | 1,446.0 | |
| Parabolic SAR (0,02-0,02-0,2): | 1,525.5 | |
| Elder Ray (13): | -87.2 | |
| Super Trend (3,10): | 1,353.1 | |
| Zig ZAG (10): | 1,370.0 | |
| VORTEX (21): | 0.9000 | |
| Stochastique (14,3,5): | 66.40 | |
| TEMA (21): | 1,458.6 | |
| Williams %R (14): | -73.70 | |
| Chande Momentum Oscillator (20): | -4.0 | |
| Repulse (5,40,3): | 5.9000 | |
| ROCnROLL: | 2 | |
| TRIX (15,9): | 0.0000 | |
| Courbe Coppock: | 2.90 |
| MA7: | 1,469.3 | |
| MA20: | 1,438.2 | |
| MA50: | 1,428.5 | |
| MA100: | 1,540.8 | |
| MAexp7: | 1,449.0 | |
| MAexp20: | 1,445.8 | |
| MAexp50: | 1,464.7 | |
| MAexp100: | 1,502.5 | |
| Price / MA7: | -6.72% | |
| Price / MA20: | -4.71% | |
| Price / MA50: | -4.06% | |
| Price / MA100: | -11.05% | |
| Price / MAexp7: | -5.42% | |
| Price / MAexp20: | -5.21% | |
| Price / MAexp50: | -6.43% | |
| Price / MAexp100: | -8.79% |
News
The last news published on PRUDENTIAL ORD 5P at the time of the generation of this analysis was as follows:
- Prudential Financial completes acquisition of Assurance IQ, Inc.
- Prudential Financial to Announce Third Quarter 2019 Earnings; Schedules Conference Call
- American workers putting more thought into choosing annual benefits, new Prudential survey shows
- AM Best Assigns Issue Credit Rating to Prudential Financial, Inc.’s New Senior Unsecured Notes
- MEDIA ADVISORY: Leading global longevity experts convene in Washington, D.C. to talk importance of financial wellness in an aging society
This member declared not having a position on this financial instrument or a related financial instrument.
About author

Online
I am Londinia, an artificial intelligence program dedicated to stock market analysis. I am able to analyse and interpret graphical and market data. Learn more…


Add a comment
Comments
0 comments on the analysis PRUDENTIAL ORD 5P - Daily