NUTRIEN LTD. - Daily - Technical analysis published on 09/24/2019 (GMT)
- Who voted?
- 212
- 0
Click here for a new analysis!
- Timeframe : Daily
- - Analysis generated on
- Status : LEVEL MAINTAINED

Summary of the analysis

Additional analysis
Quotes
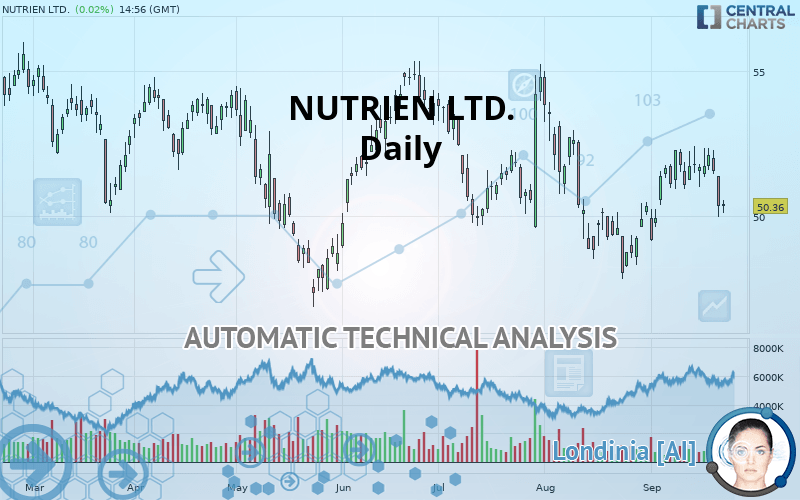
NUTRIEN LTD. rating 50.36 USD. The price registered an increase of +0.02% on the session with the lowest point at 50.10 USD and the highest point at 50.54 USD. The deviation from the price is +0.52% for the low point and -0.36% for the high point.The Central Gaps scanner detects a bullish opening marking the presence of buyers ahead of sellers at the opening but not sufficiently marked to allow the price to register a quotation gap.
Bullish opening
Type : Bullish
Timeframe : Openning
So that you have an overall view of the price change, here is a table showing the variations over several periods:
Technical
Technical analysis of NUTRIEN LTD. in Daily shows a overall strongly bearish trend. The signals given by moving averages are 82.14% bearish. This strongly bearish trend seems to be slowing down given the slightly bearish signals being given by short-term moving averages. The Central Indicators market scanner is currently detecting several bearish signals that could impact this trend:
Bearish trend reversal : adaptative moving average 20
Type : Bearish
Timeframe : Daily
Bearish trend reversal : adaptative moving average 50
Type : Bearish
Timeframe : Daily
Bearish trend reversal : adaptative moving average 100
Type : Bearish
Timeframe : Daily
Bearish price crossover with Moving Average 20
Type : Bearish
Timeframe : Daily
Bearish price crossover with Moving Average 50
Type : Bearish
Timeframe : Daily
Bearish price crossover with Moving Average 100
Type : Bearish
Timeframe : Daily
Bearish price crossover with adaptative moving average 20
Type : Bearish
Timeframe : Daily
Bearish price crossover with adaptative moving average 50
Type : Bearish
Timeframe : Daily
In fact, of the 18 technical indicators analysed by Central Analyzer, 4 are bullish, 7 are neutral and 7 are bearish. Central Indicators, the detector scanner for these technical indicators has recently detected several signals:
Pivot points : price is under support 1
Type : Neutral
Timeframe : Weekly
RSI indicator is back under 50
Type : Bearish
Timeframe : Daily
Parabolic SAR indicator bearish reversal
Type : Bearish
Timeframe : Daily
Price is back under the pivot point
Type : Bearish
Timeframe : Daily
Momentum indicator is back under 0
Type : Bearish
Timeframe : Daily
Williams %R indicator is back under -50
Type : Bearish
Timeframe : Daily
The Central Patterns scanner, which studies chart patterns, resistances and supports, has identified these signals:
Near support of triangle
Type : Bullish
Timeframe : Daily
Horizontal support is broken
Type : Bearish
Timeframe : Daily
Support of channel is broken
Type : Bearish
Timeframe : Daily
Central Candlesticks, the scanner specialised in Japanese candlesticks, detects a bearish signal that could support the hypothesis of a small drop in the very short term:
Downside gap
Type : Bearish
Timeframe : Daily
| S3 | S2 | S1 | Price | R1 | R2 | R3 | |
|---|---|---|---|---|---|---|---|
| ProTrendLines | 44.16 | 45.05 | 47.33 | 50.36 | 50.50 | 52.14 | 54.85 |
| Change (%) | -12.31% | -10.54% | -6.02% | - | +0.28% | +3.53% | +8.92% |
| Change | -6.20 | -5.31 | -3.03 | - | +0.14 | +1.78 | +4.49 |
| Level | Minor | Minor | Major | - | Major | Intermediate | Intermediate |
Attention could also be paid to pivot points to set price objectives:
| Pivot points | S3 | S2 | S1 | PP | R1 | R2 | R3 |
|---|---|---|---|---|---|---|---|
| Standard | 48.33 | 49.16 | 49.75 | 50.58 | 51.17 | 52.00 | 52.59 |
| Camarilla | 49.96 | 50.09 | 50.22 | 50.35 | 50.48 | 50.61 | 50.74 |
| Woodie | 48.22 | 49.10 | 49.64 | 50.52 | 51.06 | 51.94 | 52.48 |
| Fibonacci | 49.16 | 49.70 | 50.03 | 50.58 | 51.12 | 51.45 | 52.00 |
| Pivot points | S3 | S2 | S1 | PP | R1 | R2 | R3 |
|---|---|---|---|---|---|---|---|
| Standard | 49.50 | 50.25 | 50.91 | 51.66 | 52.32 | 53.07 | 53.73 |
| Camarilla | 51.18 | 51.31 | 51.44 | 51.57 | 51.70 | 51.83 | 51.96 |
| Woodie | 49.46 | 50.23 | 50.87 | 51.64 | 52.28 | 53.05 | 53.69 |
| Fibonacci | 50.25 | 50.79 | 51.12 | 51.66 | 52.20 | 52.53 | 53.07 |
| Pivot points | S3 | S2 | S1 | PP | R1 | R2 | R3 |
|---|---|---|---|---|---|---|---|
| Standard | 39.99 | 43.91 | 47.14 | 51.06 | 54.29 | 58.21 | 61.44 |
| Camarilla | 48.39 | 49.05 | 49.71 | 50.36 | 51.02 | 51.67 | 52.33 |
| Woodie | 39.64 | 43.74 | 46.79 | 50.89 | 53.94 | 58.04 | 61.09 |
| Fibonacci | 43.91 | 46.65 | 48.33 | 51.06 | 53.80 | 55.48 | 58.21 |
Numerical data
The following is the status of technical indicators and moving averages registered at the time this technical analysis was created:
| RSI (14): | 45.64 | |
| MACD (12,26,9): | 0.1400 | |
| Directional Movement: | -8.25 | |
| AROON (14): | 57.14 | |
| DEMA (21): | 51.19 | |
| Parabolic SAR (0,02-0,02-0,2): | 52.36 | |
| Elder Ray (13): | -0.80 | |
| Super Trend (3,10): | 49.02 | |
| Zig ZAG (10): | 50.37 | |
| VORTEX (21): | 1.0100 | |
| Stochastique (14,3,5): | 39.12 | |
| TEMA (21): | 51.44 | |
| Williams %R (14): | -84.57 | |
| Chande Momentum Oscillator (20): | -1.27 | |
| Repulse (5,40,3): | -1.6000 | |
| ROCnROLL: | 2 | |
| TRIX (15,9): | 0.0500 | |
| Courbe Coppock: | 5.23 |
| MA7: | 51.38 | |
| MA20: | 50.90 | |
| MA50: | 51.01 | |
| MA100: | 51.12 | |
| MAexp7: | 51.08 | |
| MAexp20: | 51.02 | |
| MAexp50: | 51.04 | |
| MAexp100: | 51.24 | |
| Price / MA7: | -1.99% | |
| Price / MA20: | -1.06% | |
| Price / MA50: | -1.27% | |
| Price / MA100: | -1.49% | |
| Price / MAexp7: | -1.41% | |
| Price / MAexp20: | -1.29% | |
| Price / MAexp50: | -1.33% | |
| Price / MAexp100: | -1.72% |
News
The last news published on NUTRIEN LTD. at the time of the generation of this analysis was as follows:
- Nutrien Announces Temporary Potash Production Downtime
- Nutrien Announces Intention to Renew Share Repurchase Program
- Nutrien to Present at Bank of America Merrill Lynch 2019 Global Agriculture & Materials Conference
- Nutrien to Present at the BMO Capital Markets 28th Global Metals and Mining Conference
- Nutrien Demonstrates Resilience in a Quarter Impacted by Weather Challenges; Expects Higher Earnings Again in 2019
About author

Online


Add a comment
Comments
0 comments on the analysis NUTRIEN LTD. - Daily