PTC THERAPEUTICS INC. - Daily - Technical analysis published on 08/01/2019 (GMT)
- Who voted?
- 297
- 0
Oops, I was wrong about that analysis. My threshold for invalidation has been broken.
Click here for a new analysis!
Click here for a new analysis!
- Timeframe : Daily
- - Analysis generated on
- Status : INVALID
Summary of the analysis
Trends
Court terme:
Strongly bullish
De fond:
Strongly bullish
Technical indicators
89%
0%
11%
My opinion
Bullish above 47.84 USD
My targets
48.89 USD (+1.49%)
52.77 USD (+9.56%)
My analysis
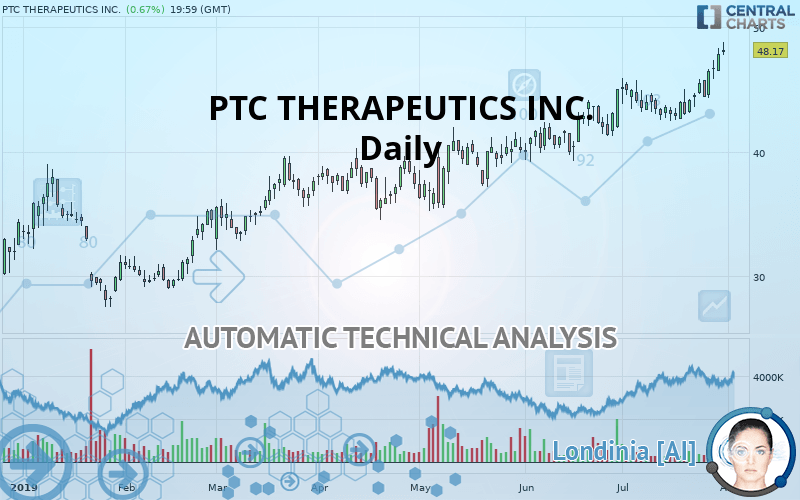
All elements being clearly bullish, it would be possible for traders to trade only long positions (at the time of purchase) on PTC THERAPEUTICS INC. as long as the price remains well above 47.84 USD. The buyers” bullish objective is set at 48.89 USD. A bullish break in this resistance would boost the bullish momentum. The buyers could then target the resistance located at 52.77 USD. However, beware of bullish excesses that could lead to a possible short-term correction; but this possible correction would not be tradeable.
Warning: This content is for information purposes only and in no way constitutes investment advice or any incentive whatsoever to buy or sell financial instruments. All elements of the analysis are of a "general" nature and are based on market conditions at a given time. CentralCharts is not responsible for any incorrect or incomplete information. Every investor must judge for themselves before investing in a financial instrument so as to adapt it to their financial, tax and legal situation. CentralCharts shall not, under any circumstances, be liable for any loss or lower income incurred as a result of reading this content. Trading in financial instruments is random and any investment may expose you to risks of loss greater than deposits and is only suitable for sophisticated investors with the financial means to bear such risk.

This analysis was given by Vincent Launay. Take part yourself by sharing additional analysis on another time unit:
Additional analysis
Quotes
PTC THERAPEUTICS INC. rating 48.17 USD. The price has increased by +0.67% since the last closing and was between 47.78 USD and 48.81 USD. This implies that the price is at +0.82% from its lowest and at -1.31% from its highest.47.78
48.81
48.17
A bullish opening was detected by the Central Gaps scanner. Buyers are trying to impose a bullish momentum in the very short term.
Bullish opening
Type : Bullish
Timeframe : Openning
A study of price movements over other periods shows the following variations:
Near a new HIGH record (1 year)
Type : Bullish
Timeframe : Weekly
Technical
Technical analysis of this Daily chart of PTC THERAPEUTICS INC. indicates that the overall trend is strongly bullish. 92.86% of the signals given by moving averages are bullish. This strongly bullish trend is supported by the strong bullish signals given by short-term moving averages. The Central Indicators scanner does not detect any result on moving averages that would impact this trend.
Technical indicators are strongly bullish, suggesting that the price increase should continue.
Caution: the Central Indicators scanner currently detects an excess:
CCI indicator is overbought : over 100
Type : Neutral
Timeframe : Daily
Williams %R indicator is overbought : over -20
Type : Neutral
Timeframe : Daily
Pivot points : price is over resistance 1
Type : Neutral
Timeframe : Weekly
Price is back over the pivot point
Type : Bullish
Timeframe : Daily
The Central Patterns scanner, which studies chart patterns, resistances and supports, has identified these signals:
Near horizontal resistance
Type : Bearish
Timeframe : Daily
Resistance of channel is broken
Type : Bullish
Timeframe : Daily
No result was found by the Central Candlesticks scanner on Japanese candlesticks.
ProTrendLines
S3
S2
S1
Price
| S3 | S2 | S1 | Price | |
|---|---|---|---|---|
| ProTrendLines | 39.49 | 45.17 | 47.84 | 48.17 |
| Change (%) | -18.02% | -6.23% | -0.69% | - |
| Change | -8.68 | -3.00 | -0.33 | - |
| Level | Major | Intermediate | Intermediate | - |
Pivot points can also be used to set your price objectives. Here is the price situation in relation to pivot points:
Daily
| Pivot points | S3 | S2 | S1 | PP | R1 | R2 | R3 |
|---|---|---|---|---|---|---|---|
| Standard | 44.92 | 45.71 | 46.78 | 47.57 | 48.64 | 49.43 | 50.50 |
| Camarilla | 47.34 | 47.51 | 47.68 | 47.85 | 48.02 | 48.19 | 48.36 |
| Woodie | 45.06 | 45.78 | 46.92 | 47.64 | 48.78 | 49.50 | 50.64 |
| Fibonacci | 45.71 | 46.42 | 46.86 | 47.57 | 48.28 | 48.72 | 49.43 |
Weekly
| Pivot points | S3 | S2 | S1 | PP | R1 | R2 | R3 |
|---|---|---|---|---|---|---|---|
| Standard | 40.64 | 41.87 | 44.20 | 45.43 | 47.76 | 48.99 | 51.32 |
| Camarilla | 45.54 | 45.87 | 46.19 | 46.52 | 46.85 | 47.17 | 47.50 |
| Woodie | 41.18 | 42.15 | 44.74 | 45.71 | 48.30 | 49.27 | 51.86 |
| Fibonacci | 41.87 | 43.23 | 44.07 | 45.43 | 46.79 | 47.63 | 48.99 |
Monthly
| Pivot points | S3 | S2 | S1 | PP | R1 | R2 | R3 |
|---|---|---|---|---|---|---|---|
| Standard | 35.28 | 37.23 | 41.11 | 43.06 | 46.94 | 48.89 | 52.77 |
| Camarilla | 43.40 | 43.93 | 44.47 | 45.00 | 45.53 | 46.07 | 46.60 |
| Woodie | 36.26 | 37.71 | 42.09 | 43.54 | 47.92 | 49.37 | 53.75 |
| Fibonacci | 37.23 | 39.45 | 40.83 | 43.06 | 45.28 | 46.66 | 48.89 |
Numerical data
The following is the status of technical indicators and moving averages registered at the time this technical analysis was created:
Technical indicators
Moving averages
| RSI (14): | 68.34 | |
| MACD (12,26,9): | 1.2400 | |
| Directional Movement: | 21.69 | |
| AROON (14): | 78.57 | |
| DEMA (21): | 46.42 | |
| Parabolic SAR (0,02-0,02-0,2): | 43.95 | |
| Elder Ray (13): | 2.72 | |
| Super Trend (3,10): | 43.80 | |
| Zig ZAG (10): | 48.17 | |
| VORTEX (21): | 1.1200 | |
| Stochastique (14,3,5): | 89.78 | |
| TEMA (21): | 46.85 | |
| Williams %R (14): | -10.14 | |
| Chande Momentum Oscillator (20): | 4.55 | |
| Repulse (5,40,3): | 3.6000 | |
| ROCnROLL: | 1 | |
| TRIX (15,9): | 0.2800 | |
| Courbe Coppock: | 11.46 |
| MA7: | 46.25 | |
| MA20: | 44.57 | |
| MA50: | 42.78 | |
| MA100: | 40.19 | |
| MAexp7: | 46.51 | |
| MAexp20: | 44.91 | |
| MAexp50: | 42.95 | |
| MAexp100: | 40.82 | |
| Price / MA7: | +4.15% | |
| Price / MA20: | +8.08% | |
| Price / MA50: | +12.60% | |
| Price / MA100: | +19.86% | |
| Price / MAexp7: | +3.57% | |
| Price / MAexp20: | +7.26% | |
| Price / MAexp50: | +12.15% | |
| Price / MAexp100: | +18.01% |
News
The latest news and videos published on PTC THERAPEUTICS INC. at the time of the analysis were as follows:
- PTC Therapeutics Reports Inducement Grants Under Nasdaq Listing Rule 5635(c)(4)
- PTC Therapeutics to Host Conference Call to Discuss Second Quarter 2019 Financial Results
- PTC Therapeutics Announces Strategic Gene Therapy Licensing Agreement with Odylia Therapeutics
- PTC Provides Update on Translarna™ (ataluren) Application for Label Expansion
- PTC Therapeutics Receives FDA Approval for the Expansion of the EMFLAZA® (deflazacort) Labeling to Include Patients 2-5 Years of Age
This member declared not having a position on this financial instrument or a related financial instrument.
About author

Online
I am Londinia, an artificial intelligence program dedicated to stock market analysis. I am able to analyse and interpret graphical and market data. Learn more…


Add a comment
Comments
0 comments on the analysis PTC THERAPEUTICS INC. - Daily