Publicis Groupe: Full Year 2020 Results
- 81
Regulatory News:
This press release features multimedia. View the full release here: https://www.businesswire.com/news/home/20210202006197/en/
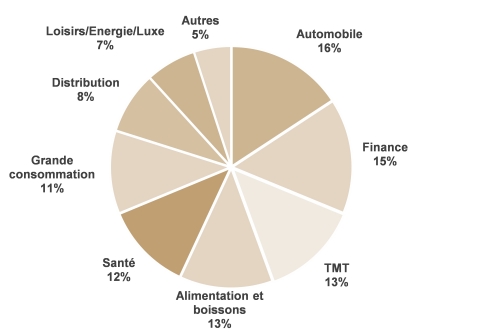
Répartition du revenu net 2020 par secteur - Sur la base de 3 620 clients représentant 91% du revenu net total du Groupe (Photo: Business Wire)
Publicis Groupe (Paris:PUB):
FY 2020 Results
(€m) |
FY 2020 |
|
2020 vs 2019 |
|
Net revenue |
9,712 |
|
-0.9% |
|
Organic growth |
|
|
-6.3% |
|
EBITDA |
2,158 |
|
-3.9% |
|
Operating margin |
1,558 |
|
-6.1% |
|
Operating margin rate |
16.0% |
|
-90bps |
|
Headline Groupe net income |
1,034 |
|
-13.0% |
|
Headline diluted EPS (euro) |
4.27 |
|
-14.9% |
|
Free Cash Flow before change in working capital |
1,190 |
|
-5.0% |
Q4 2020 Revenue
Net revenue |
€2,595 M |
|
Reported growth |
-9.6% |
|
Organic growth |
-3.9% |
| ______________________ |
1 To be proposed to the shareholders at the AGM of May, 26 2021 |
Arthur Sadoun, Chairman and CEO of Publicis Groupe:
"In the tough context of 2020, Publicis posted solid performance thanks to our transformation.
Our long-term investment in data and technology, our country model, and our platform Marcel, have enabled us to stay strong by containing our revenue decline and maintaining best-in-class financials.
We outperformed the industry average in this year of exceptional crises by delivering a published growth of -0.9% in 2020 and organic growth at -6.3% for the year, with a Q4 ahead of market and our expectations at -3.9%.
This is the result of our ability to capture the shift in our clients’ investment towards digital channels, e-commerce and direct-to-consumer, which intensified throughout the year.
It is particularly visible in the U.S. where Epsilon delivered growth of 5.5% in Q4, enabling our most important country to be slightly positive. This was also the case for Publicis Sapient.
We gained market share by growing with our top 200 clients by 1.8%, and recorded a continued new business momentum with wins like Kraft-Heinz, Reckitt Benckiser, Pfizer, Visa, L’Oréal in China, TikTok and Sephora.
Last but not least, we continued to post the best financial ratios of the industry with an operating margin rate of 16% and a free cash flow of close to 1.2 billion Euros while significantly reducing our net debt at around 800 million euros at year-end.
Today, our solid results mean we are able to propose a dividend of 2€, slightly below our pre-pandemic level, corresponding to a payout of 46.8%.
It is important to note the sustainability of this performance, which was achieved with virtually no benefit from government schemes, including in France where we decided not to take advantage of any state aid.
When we saw at the beginning of the crisis how devastating the pandemic could be, we quickly acted to redefine our plans. This included a voluntary pay cut by around 6000 of our managers, and a new set of objectives for the rest of the year. Thanks to the collective and extraordinary performance of our people in these difficult times, we have been able to post results that are above industry averages, allowing us to repay the salary sacrifice and set aside a higher bonus pool to fairly reward and recognize our teams.
I’d like to thank everyone in the group for their incredible efforts and our clients for their confidence and partnership.
It is clear now that the crisis did not end with 2020. The world will continue to be marked by the social and the economic effects of the pandemic for some time. So we are going into this new year with a renewed fighting spirit, ready to double down on our efforts to keep our people safe, make our clients win in a platform world and continue to improve our efficiency.
Our transformation helped us stand strong in the storm of the past year. We are clear-sighted about the challenges that lie ahead, but thanks to our assets, our model, our people, and the trust of our clients, we are confident that we will emerge from this crisis as a stronger company."
* *
*
Publicis Groupe’s Supervisory Board met on February 2, 2021, under the chairmanship of Maurice Lévy, to examine the 2020 annual accounts presented by Arthur Sadoun, CEO and Chairman of the Management Board.
KEY FIGURES
EUR million, except per-share data and percentages |
FY 2020 |
FY 2019 |
2020
|
|||
Data from the Income Statement and Cash flow Statement |
|
|
|
|||
Net revenue |
9,712 |
9,800 |
-0.9% |
|||
Pass-through revenue |
1,076 |
1,201 |
-10.4% |
|||
Revenue |
10,788 |
11,001 |
-1.9% |
|||
EBITDA |
2,158 |
2,245 |
-3.9% |
|||
% of Net revenue |
22.2% |
22.9% |
-70 bps |
|||
Operating margin excluding transaction costs (1) |
1,558 |
1,699 |
-8.3% |
|||
% of Net revenue |
16.0% |
17.3% |
-130 bps |
|||
Operating margin |
1,558 |
1,659 |
-6.1% |
|||
% of Net revenue |
16.0% |
16.9% |
-90 bps |
|||
Operating income |
983 |
1,267 |
-22.4% |
|||
Net income attributable to the Groupe |
576 |
841 |
-31.5% |
|||
Earnings Per Share (EPS) |
2.40 |
3.59 |
-33.1% |
|||
Headline diluted EPS (2) |
4.27 |
5.02 |
-14.9% |
|||
Dividend per share (3) |
2.00 |
1.15 |
+73.9% |
|||
Free Cash Flow before change in working capital requirements |
1,190 |
1,253 |
-5.0% |
|||
Data from the Balance Sheet |
Dec. 31, 2020 |
Dec. 31, 2019 |
||||
Total assets |
30,161 |
32,659 |
-7.6% |
|||
Groupe share of Shareholders’ equity |
7,182 |
7,401 |
-2.9% |
|||
Net debt (net cash) |
833 |
2,713 |
-69.3% |
(1) |
Transaction costs related to the acquisition of Epsilon totaled 40 million euros in 2019 |
|
(2) |
Net income attributable to the Groupe, after elimination of impairment charges, amortization of intangibles arising on acquisitions, the main capital gains (or losses) on disposals, change in the fair value of financial assets, the costs of the anticipated unwinding of cross-currency swaps (in 2020), the revaluation of earn-out costs and Epsilon transaction costs (in 2019), divided by the average number of shares on a diluted basis |
|
(3) |
To be proposed to the shareholders at the AGM of May 26, 2021 |
NET REVENUE IN FY 2020
Publicis Groupe’s net revenue for the full year 2020 was 9,712 million euros, down by 0.9% compared to 9,800 million euros in 2019. Exchange rate variations over the period have a negative impact of 219 million euros. Acquisitions (net of disposals) have a contribution of 729 million euros on net revenue, most of it being related to the acquisition of Epsilon.
2020 was overall impacted by the effects of the Covid-19 pandemic that spread across the world from March. Thanks to its transformation, the Groupe posted a resilient performance with organic growth of -6.3% that was notably supported by the activities in the U.S (organic growth of -2.0%). The Covid-19 crisis impact started at the end of the first quarter, and resulted in a significant drop in organic growth in Q2 (-13.0%) following the containment measures that were implemented by governments in different geographies. Organic growth came at -5.6% and -3.9% respectively in Q3 and Q4, as the activity continued to be impacted by the crisis but showed improvement. Throughout the year, the Groupe’s long-term investment in data and technology, its country-model organization and its platform Marcel have enabled it to mitigate the revenue decline linked to the crisis, by capturing the shift in clients’ investment towards digital channels, e-commerce and direct-to-consumer.
Breakdown of FY 2020 net revenue by region
EUR |
Net revenue |
|
Reported |
|
Organic |
|||
million |
FY 2020 |
|
FY 2019 |
|
growth |
|
growth |
|
Europe |
2,278 |
2,630 |
-13.4% |
|
-12.7% |
|||
North America |
5,997 |
5,516 |
+8.7% |
|
-2.4% |
|||
Asia Pacific |
932 |
1,006 |
-7.4% |
|
-6.7% |
|||
Latin America |
230 |
326 |
-29.4% |
|
-13.9% |
|||
Middle East & Africa |
275 |
322 |
-14.6% |
|
-11.7% |
|||
Total |
9,712 |
9,800 |
-0.9% |
|
-6.3% |
|||
Net revenue in Europe was -13.4% on a reported basis and -12.7% on an organic basis. Early in the year, all main countries in Europe took drastic measures to mitigate the impact of the Covid-19 crisis, with successive lockdowns or curfews that spanned from Q2 to Q4. In this context, the United Kingdom posted organic growth of -12.4%. France, at -19.7% organic, was particularly impacted by its specific outdoor media activities and the Drugstore that were shut down during part of the year. Excluding this impact, organic growth was -12.5% in France and -10.8% in Europe in 2020. Net revenue in Germany was down 7.7% organically. Creative and Media performance varied depending on the countries, but overall were resilient and posted a better performance than the Groupe in the region, while Publicis Sapient was down and Health activities grew in the year.
In North America, reported growth was +8.7% and organic growth was -2.4%. The U.S. posted a resilient performance with a decline in its organic growth limited to 2.0%. After a positive Q1, the U.S. demonstrated resilience in Q2 and Q3 in the crisis, to finally end Q4 slightly positive. Epsilon 2.0 has been contributing to U.S. organic growth since Q3 and grew 5.5% in Q4. Publicis Sapient organic growth in the U.S. was negative in the year as some projects were put on hold during the crisis but turned positive in Q4. Health had a particularly strong year, with a double-digit growth. Canada organic growth was down 10.9% in 2020.
Asia Pacific was down by 7.4% on a reported basis and 6.7% on an organic basis. China, the first country impacted by Covid-19, recorded organic growth of -8.1% in 2020. Growth there sequentially improved in Q4 at -4.2%, notably thanks to a slightly positive growth in Media activity.
In Latin America, the activity was significantly impacted by the health situation in Brazil and Mexico, which resulted in organic growth of -13.9% in 2020 for the region. In addition, the evolution of currency exchange rates had a strong negative impact in the region. As a result, the reported growth in the region was -29.4%.
Middle-East and Africa was down by 14.6% on a reported basis (-11.7% on an organic basis), mostly driven by the health situation in some countries like Israel and South Africa, and by some projects coming to an end in the United Arab Emirates for Publicis Sapient.
NET REVENUE IN Q4 2020
Publicis Groupe's net revenue in Q4 2020 was 2,595 million euros compared to 2,871 million euros in Q4 2019, down by 9.6%. Exchange rate variations had a 156 million euros negative impact. The acquisitions (net of disposals) were a negative 13 million impact to net revenue in Q4 2020.
Organic growth was -3.9% in Q4 2020.
With a +0.5% organic growth, the activity was particularly resilient in the U.S., where the Groupe’s digital media activities, Epsilon, Publicis Sapient and Health practice all recorded increase in net revenue. Creative and Media continued to be impacted by the crisis but the decline was partly mitigated by a rise in net revenue for digital media and content production businesses.
In Europe, organic growth was -9.1% as the region continued to be impacted by the various restrictive measures taken by governments to face Covid-19, such as lockdowns or curfews in all of the Groupe’s main countries. The UK was down 11.0% organically, as was Germany (-10.9%). The situation in France improved sequentially, with organic growth of -7.2%, driven by a positive media performance in Q4.
In Asia Pacific, organic growth remained negative in Q4 at -8.6%, but improved sequentially compared to Q3, driven by China. China posted a 4.2% decline in organic in Q4, improving sequentially and recording an encouraging series of wins.
Latin America declined by 29.0% on a reported basis, mostly due to negative exchange rate variations and a continued negative performance in Brazil and Mexico that drove a 10.8% decline in organic. Middle-East and Africa declined 12.1% on an organic basis (-17.9% reported), notably due to some projects that came to an end in Q4 2020 at Publicis Sapient in the United Arab Emirates.
Breakdown of Q4 2020 Net revenue by region
EUR |
Net revenue |
|
Reported |
|
Organic |
|||
million |
Q4 2020 |
|
Q4 2019 |
|
growth |
|
growth |
|
Europe |
643 |
728 |
-11.7% |
|
-9.1% |
|||
North America |
1,530 |
1,639 |
-6.7% |
|
+0.2% |
|||
Asia Pacific |
268 |
302 |
-11.3% |
|
-8.6% |
|||
Latin America |
76 |
107 |
-29.0% |
|
-10.8% |
|||
Middle East & Africa |
78 |
95 |
-17.9% |
|
-12.1% |
|||
Total |
2,595 |
2,871 |
-9.6% |
|
-3.9% |
|||
ANALYSIS OF FY 2020 KEY FIGURES
Income Statement
EBITDA amounted to 2,158 million euros in 2020, compared to 2,245 million euros in 2019, down by 3.9%. The impact of the cost reduction plan announced in April was 467 million euros in 2020, on a comparable basis and excluding Epsilon acquisition costs. EBITDA is 22.2% as a percentage of net revenue (compared to 22.9% in 2019).
- Personnel costs totaled 6,242 million euros in 2020, up by 2.8% from 6,073 million euros in 2019. This evolution reflects the consolidation of Epsilon since July 2019 that continued to have an impact in the first half of 2020, that was partly compensated by the cost reduction plan launched by the Groupe. As a percentage of net revenue, the personnel expenses represented 64.3% in 2020, compared to 62.0% in 2019. Fixed personnel costs were 5,457 million euros represented 56.2% of net revenue versus 54.6% in 2019. Despite the consolidation of Epsilon during the first half, fixed personnel costs only increased by 104 million euros, thanks to the actions taken by the Groupe, such as a hiring freeze, pause in internal promotions or shorter work weeks. Moreover, the Groupe decided to limit the use of freelancers. As a result, the cost of freelancers declined by 70 million euros in 2020, representing 278 million euros. Restructuring costs reached 175 million euros (116 million euros in 2019), reflecting additional charges related to the cost reduction plan.
- Other operating expenses (excluding depreciation & amortization) amounted to 2,388 million euros, compared to 2,683 million euros in 2019. This represents 24.6% of net revenue compared to 27.4% in 2019, indicating that the cost reduction measures more than offset the negative impact of Epsilon cost structure on this ratio. The Groupe was able to make significant savings on other operating expenses in 2020, thanks to the actions taken as part of the cost reduction plan, but also thanks to some expenses that were drastically reduced during the lockdowns. This was notably the case with travel, recruitment and seminar related expenses.
Depreciation and amortization charge was 600 million euros in 2020, up by +2.4% compared to 2019. The increase is largely due to the consolidation of Epsilon over the period.
The operating margin amounted to 1 558 million euros, down by 6.1% compared to 2019. This represents a margin rate of 16.0%, down by 90 basis points from 16.9% in 2019. When compared to the 2019 margin excluding Epsilon acquisition costs, the margin declined by 130 basis points. This decrease is due to the decline in organic growth related to the impact of the Covid-19 crisis, partially offset by a 5.4% reduction in the 2019 cost base at constant exchange rates and perimeter.
Operating margin rates by major geographic areas reflected the various challenges faced by the different regions in 2020, in the context of the global pandemic. It was 10.2% in Europe, 18.6% in North America, 18.2% in Asia-Pacific, 10.4% in Latin America and 5.8% in the Africa / Middle East region.
Amortization of intangibles arising from acquisitions totaled 339 million euro in 2020, up from 204 million euro in 2019. This increase is due to the full-year impact of the amortization of Epsilon intangibles and of tradenames arising from acquisitions, both having started to be amortized in July 2019. Impairment losses amounted to 241 million euros, of which 226 million euros related to the real estate consolidation plan "All in One", which leads to a reduction in the number of sites, while allowing better collaboration between the teams. In 2019, impairment losses were 209 million euros (of which 127 million euros related to real estate plan “All in One”). In addition, net non-current income is positive at 5 million euros 2020, compared to an income of 21 million euros in 2019.
Operating income totaled 983 million euro in 2020, after 1,267 million euro in 2019.
The financial result, comprising the cost of net financial debt and other financial charges and income, is an expense of 198 million euros in 2020 compared to an expense of 91 million euros last year. The net expense on net financial debt was 103 million euros in 2020, including a 143 million euros interest expense on gross debt. Last year, it was a charge of 25 million euros. Other financial income and expenses were a charge of 95 million euros in 2020, notably composed by 77 million euros interest on lease liabilities, and a 16 million euros charge related to an anticipated unwinding of cross currency swaps. Other financial income and expenses were a charge of 66 million euros in 2019, including 70 million euros of interest on lease obligations.
The revaluation of earn-out payments amounted to a loss of 17 million euros, compared to a charge of 22 million at end-2019.
The tax charge is 196 million euros, corresponding to an effective tax rate of 24.7% in 2020, compared to 305 million euros in 2019, corresponding to an effective tax rate of 25.0% in 2019.
The share in the profit of associates is a loss of 1 million euros, compared to a loss of 5 million euros in 2019. Minority interests were an income of 5 million euros in Groupe results in 2020 compared to a loss of 3 million in the previous year.
Overall, net income attributable to the Groupe was 576 million euros at December 31, 2020, compared to 841 million euro at December 31, 2019.
Free Cash Flow
EUR million |
FY 2020 |
FY 2019 |
||
EBITDA |
2,158 |
2,245 |
||
Financial interest paid (net) |
(113) |
11 |
||
Repayment of lease liabilities and related interests |
(461) |
(480) |
||
Tax paid |
(293) |
(349) |
||
Other |
54 |
51 |
||
Cash Flow from operations before change in WCR |
1,345 |
1,478 |
||
Investments in fixed assets (net) |
(155) |
(225) |
||
Free cash-flow before changes in WCR |
1,190 |
1,253 |
The Groupe’s free cash flow, before change in working capital requirements, is down by 5.0% at 1,190 million euros compared to 2019. Financial interest paid mostly include interests on the acquisition debt of Epsilon. Tax paid amounted to 293 million euros, down compared to 349 million euros in 2019. The decrease in net investments in fixed assets amounted to 70 million euros. The Groupe was very selective regarding its investment policy, favouring IT spending especially to support work from home initiatives that have been implemented in 2020.
Net debt
Net financial debt amounted to 833 million euros as of December 31, 2020 compared to 2,713 million euros as of December 31, 2019. The Groupe's average net debt in 2020 amounted to 3,286 million euros compared to 2,375 million euros in 2019. The increase in average net debt reflects the financing linked to the acquisition of Epsilon, for 4.5 billion dollars, as of July, 1st 2019.
CHANGES IN DIRECTOIRE
On November 25 2020, Publicis Groupe announced the appointment of Michel-Alain Proch as Groupe’s Chief Financial Officier, member of the Directoire, replacing Jean-Michel Etienne.
Michel-Alain Proch joined the Groupe on January 18 2021, and will take over the full operational functions of the Chief Financial Officer role, after the closing and presentation of the 2020 financial results on February 3.
Jean-Michel Etienne will remain with the Groupe until summer 2021 as Special Advisor to the Chairman and CEO of Publicis Groupe, and will oversee central services and Re:Sources in particular.
Michel-Alain Proch has 25 years of experience in finance, strategy, integration and transformation, acquired within major technology groups. He was appointed Chief Financial Officer of Ingenico in February 2019 until the company was acquired by Worldline in November 2020. Since then, he has been advising its Chairman & CEO on the integration process. Previously, he was SEVP & Group Chief Digital Officer at Atos in 2018 after having led the group’s operations in North America from 2015 to 2017. As EVP and Group Chief Financial Officer of Atos from 2007 to 2015, he led several major M&A operations and successfully co-led the IPO of Worldline. He was Board Member of Worldline until 2016. He had previously held senior executive roles at Hermès in France and the United-States for 8 years. He started his career as a consultant at Deloitte & Touche in France and in the UK.
ACQUISITIONS AND DISPOSALS
There were no significant transaction on the period.
OUTLOOK
The transformation of the Groupe helped to stand strong in the storm of 2020. Looking ahead, it has also placed the Groupe on the right track to help its clients win in a platform world and therefore be a good performer in the industry.
But the crisis did not end with 2020, and the uncertainty caused by the virus will continue to dominate daily lives.
The current context prevents the Groupe from giving a full year organic guidance for 2021. The Groupe anticipates that Q1 will be negative as it faces an unfavorable comparable, and growth should return in Q2 supported by a favorable base.
When it comes to margin, the Groupe expects its operating margin rate to improve by up to 50 basis points in 2021, consolidating further the achievement of 2020. The Groupe’s ongoing cost discipline and country model will provide the necessary flexibility to adapt to the evolution of the situation, as observed in 2020, and invest accordingly in its talent.
Free cash flow before change in working capital should be around €1.2 bn in 2021, contributing to the Groupe’s deleveraging plans.
The Groupe will provide update as the level of visibility on the evolution on the health situation increases in July.
* *
*
NEW BUSINESS
EUROPE
Longchamp (Media), Intersnack (Media), E.ON (Digital & Media), Disney (Media), Vision Express (Creative), McDonald's (Technology), Biotherm (Creative), Sephora (CRM), Helmholtz-Gemeinschaft (Brand), Kingfisher France - Castorama (Creative), Ascensia (Technology), FCA (Creative), Société Générale (CRM), OPPO Mobile Telecommunication (Creative), COS (Digital), TOUS (Technology), Swissbankers (Creative), RATP (Technology), Daimler (Technology), Deutsche Post (DHL) (Technology), Novartis International (Technology), Greystar (Digital), Slimming World (Digital), Expedia (Digital), Premier Inn (Creative), Tesco (Creative), ING (Creative, Media, Production, Data), Mugler Parfums (Creative), BT (Creative), Française des Jeux (Media & Social Media), Roche (Health & Data), Lindt (Media), Peugeot Motocycles (Creative), eOne (Media), Loacker (Media), Jim Beam (Creative), Marriot (Creative), Disney Home (Creative), Nestlé Health Science (Health), NovoNordisk (Health), Système U (Data), Castorama (Data), Beam Suntory (Creative), Belambra (Creative), CSIAM (Creative), Alcon (Media), NH Hotel (Media), Renault (Data), Mercedes Vans (Data), Wendy's (Media), uSwitch (Media), Kellogg's (Digital), Calzedonia (Media), Dr. Wolff (Media), Alpen (Creative), Samsung (Data), SNCF (Creative & Data), Birds Eye (Media), TUI (Creative), Avast (Creative & Media), WBA (Creative & Data), Harry's (Creative), DHL (Health, Technology, Media), Pandora (Technology)
NORTH AMERICA
Sephora (Media), Bank of America (Media, Creative), Tailored Brands (Media), Reckitt Benckiser (Media), U.S. Cellular (Media, Creative), H&R Block (Digital Media, Digital Creative and Social), Aldi (Media), AFLAC (Digital), Whirlpool (Media & Technology), Bass Pro Shops (Media), Audi of America (Media), Pharma Vite - Nature Made (Creative), New York Life (Media, Digital Media AOR), Edgewell (Media), Abbvie (Creative strategy), Lowe's (Media), FCA (Digital), Blue Apron (Media), Ste Michelle Wine Estates (Creative), T-Mobile (Technology), Academy Sports and Outdoors (Technology), Edward Jones (Technology), Health Resources and Services Administration (HRSA) (Technology), Kellogg Company (Technology), Marriott (Technology), Mercedes-Benz USA (Technology), MGM Resorts (Technology), National Cancer Institute (NCI) (Technology), Nissan Motor Company (Technology), Polaris (Technology), Verizon Wireless Digital (Technology), WL Gore (Technology), AbbVie (Health), Roche (Health & Data), Allergan (Health), Heineken Canada (Creative), Cogeco (Creative), Mondelez (Creative), Citi (Creative), Four Seasons (Creative), FCA (Digital), Eli Lilly (Creative), Church & Dwight (Creative), Jim Beam (Creative), Cumberland Packing (Creative), Center for Internet Security (Creative & Digital), MD Anderson (Data), Facebook (Creative), P&G (Digital), CDC (Media), Mizkan Group (Media), H&R Block (Media), Lowe's (Media), Leesa (Media), Sun Basket (Media), Department of Jobs, Precincts and Regions (Technology), National Institute of Diabetes and Digestive and Kidney Diseases (Technology), U.S. Consumer Product Safety Commission (Technology), MDC General Services Holding Company LLC (Technology), Polestar Performance AB (Technology), Bridgestone Americas (Technology), Total Wine & More (Technology), Shiseido Americas (Technology), Vanguard (Media), Patron (Digital), Church & Dwight (Creative), Jim Beam (Creative), Hulu (Media), Walmart (Media), Froneri (Media), goPuff (Media), JM Smuckers (Creative), Fiat Chrysler Automobiles (Technology), Altria Group (Technology), Loblaw Digital (Technology), Philip Morris International (Technology), The Depository Trust & Clearing Corp (Technology), Marriott International (Technology), Unilever (Technology), Spirit Airlines (Technology), Comcast Corporation (Technology), UBS Asset Management (Technology), Hyundai Auto Canada Corp. (Technology), BT Pension Scheme (Technology), Carnival (Technology)
ASIA PACIFIC/MEA
FCA (Creative, Media), McDonald's (Media, Creative, Digital, Technology), Foxtel (Creative), Miral Asset Management (Technology), Samsung.com (Creative), Sanofi (Creative), Nestlé (Creative, Technology), Majid Al Futtaim Holding (Technology), Samsung (Creative), Hero (Media), Volvo (Media), Prudential Holdings (Technology), MasterCard International (Technology), SA Tourism (Creative), Disney China & Hong Kong (Media), Louis Vuitton (Creative), ChungHwa Telecom (Creative), Goodman Fielder (Media), Novartis (Health), CBL (Heineken, Tiger and ABC Cambodia) (Creative), Novo Nordisk (Health), QLD Health and Wellbeing (Creative), Hong Kong Disneyland Resort (Media), PharmEasy (Media), Tencent (Media), Planet Sports (Media), Hyundai (Media), Citi (Media), Goody (Media), Tawal (Media), MDC General Services Holding Company LLC – Mubadala (Technology), Nestlé Content Studio (Creative & Digital), Westpac (Media), P&G (Digital), Zee (Creative), Buick (Creative), Porsche (Technology), Meridian Energy (Media), Nescafe 1+2 (Creative), Clarins (Media), Eurokars (Creative & Media), The Great Barrier Reef Foundation (Creative), Bharti Axa Life Insurance (Creative, Digital, Media), Miele (Media & Data), HBF (Creative), L’Oréal (Media)
LATAM
DIRECTV (Media & Performance AOR), Coca-Cola (Creative), Electrolux (Creative), Mondelez (Media & Creative), GSK Consumer Health (Creative), P&G (Media, Creative, Digital, Technology), CCR (Creative), Ambev (Creative), Claro (Digital), Enel (Creative), Toyota (Creative), L’Oréal (Digital Creative), Bradesco (Creative & Digital), Nestlé (Media & Creative), Nutresa (CRM), Diageo (Creative Digital), Sanofi (Creative), ABI (Media), Corteva Agro (Media), Calsa (Media), Embol (Media), Electrolux (Media), TCCC (Media), Ezcorp (Media), Starbucks (Media), Avon (Media), Citi (Media), MSD Sharp & Dohme (Media), Pacific Center (Media), Tale (Media), Bellcorp (Digital)
GLOBAL
Jollibee (Creative), Enel (Creative), Loblaw Digital (Technology), Unilever (Technology), Tesco (Technology), Marriott International (Technology), General Pension and Social Security Authority (Technology), Farah Experiences (Technology), Nissan International (Technology), Royal Canin (Technology), Worldpay (Technology), Philip Morris Products OC Division (Technology), Carrefour (Technology), Bang & Olufsen (Technology), FWD Group Management Holdings (Technology), GSK (Production), Air France (Media), Tik Tok (Media), Kraft Heinz (Media), P&G (Media), Merck (Non-US) (Media), Combe (Media), Pigeon (Media), Novartis (Media), Fiat (Technology), Nestlé (Technology), Pandora (Technology), Heineken (Creative, Data & Technology), Arrow Electronics (Media), Pierre Fabre (Media), BSH (Media), Mondelez (Production), Visa (Production)
Disclaimer
Certain information contained in this document, other than historical information, may constitute forward-looking statements or unaudited financial forecasts. These forward-looking statements and forecasts are subject to risks and uncertainties that could cause actual results to differ materially from those projected. These forward-looking statements and forecasts are presented at the date of this document and, other than as required by applicable law, Publicis Groupe does not assume any obligation to update them to reflect new information or events or for any other reason. Publicis Groupe urges you to carefully consider the risk factors that may affect its business, as set out in the Universal Registration Document filed with the French Autorité des Marchés Financiers (AMF) and which is available on the website of Publicis Groupe (www.publicisgroupe.com), including an unfavorable economic climate, a highly competitive industry, risks associated with the confidentiality of personal data, the Groupe’s business dependence on its management and employees, risks associated with mergers and acquisitions, risks of IT system failures and cybercrime, the possibility that our clients could seek to terminate their contracts with us on short notice, risks associated with the reorganization of the Groupe, risks of litigation, governmental, legal and arbitration proceedings, risks associated with the Groupe’s financial rating and exposure to liquidity risks.
About Publicis Groupe - The Power of One
Publicis Groupe [Euronext Paris FR0000130577, CAC 40] is a global leader in communication. The Groupe is positioned at every step of the value chain, from consulting to execution, combining marketing transformation and digital business transformation. Publicis Groupe is a privileged partner in its clients’ transformation to enhance personalization at scale. The Groupe relies on ten expertise concentrated within four main activities: Communication, Media, Data and Technology. Through a unified and fluid organization, its clients have a facilitated access to all its expertise in every market. Present in over 100 countries, Publicis Groupe employs around 80,000 professionals.
www.publicisgroupe.com | Twitter:@PublicisGroupe | Facebook | LinkedIn | YouTube | Viva la Difference!
Appendices
Net revenue: organic growth calculation
(million euro) |
Q1 |
Q2 |
Q3 |
Q4 |
12 months |
|
Impact of currency
|
|
2019 net revenue |
2,118 |
2,234 |
2,577 |
2,871 |
9,800 |
|
GBP (2) |
(12) |
Currency impact (2) |
33 |
(1) |
(95) |
(156) |
(219) |
|
USD (2) |
(94) |
2019 net revenue at 2020 exchange rates (a) |
2,151 |
2,233 |
2,482 |
2,715 |
9,581 |
|
Others |
(112) |
2020 net revenue before acquisition impact (1) (b) |
2,088 |
1,943 |
2,344 |
2,608 |
8,983 |
|
Total |
(219) |
Net revenue from acquisitions (1) |
393 |
350 |
(1) |
(13) |
729 |
|
|
|
2020 net revenue (1) |
2,481 |
2,293 |
2,343 |
2,595 |
9,712 |
|
|
|
Organic growth (b/a) |
-2.9% |
-13.0% |
-5.6% |
-3.9% |
-6.3% |
|
|
|
(1) |
Acquisitions (Digitas AffinityID, Soft Computing, Rauxa, E2 Media, Epsilon, RDL, SearchForce, McCready Bale Media, Sapient i.7, Third Horizon), net of disposals. |
|
|
||
(2) |
EUR = 1.140 USD on average in 2020 vs. USD 1.119 on average in 2019 |
|
EUR = 0.889 GBP on average in 2020 vs. GBP 0.877 on average in 2019 |
Definitions
Net revenue or Revenue less pass-through costs: Pass-through costs mainly concern production and media activities, as well as various expenses incumbent on clients. These items that can be re-billed to clients do not come within the scope of assessment of operations, net revenue is a more relevant indicator to measure the operational performance of the Groupe’s activities.
Organic growth: Change in net revenue excluding the impact of acquisitions, disposals and currencies.
EBITDA (Earnings Before Interest, Taxes, Depreciation and Amortization): Operating margin before depreciation & amortization.
Operating margin: Revenue after personnel costs, other operating expenses (excl. non-current income and expense) and depreciation (excl. amortization of intangibles arising on acquisitions).
Operating margin rate: Operating margin as a percentage of net revenue.
Headline Group Net Income: Net income attributable to the Groupe, after elimination of impairment charges / real estate transformation expenses, amortization of intangibles arising on acquisitions, the main capital gains (or losses) on disposals, change in the fair value of financial assets, the impact of US tax reform, the revaluation of earn-out costs and Epsilon transaction costs.
EPS (Earnings per share): Group net income divided by average number of shares, not diluted.
EPS, diluted (Earnings per share, diluted): Group net income divided by average number of shares, diluted.
Headline EPS, diluted (Headline Earnings per share, diluted): Headline group net income, divided by average number of shares, diluted.
Capex: Net acquisitions of tangible and intangible assets, excluding financial investments and other financial assets.
Free Cash Flow before changes in working capital requirements: Net cash flow from operating activities less interests paid & received, repayment of lease liabilities & related interests and before changes in WCR linked to operating activities
Free Cash Flow: Net cash flow from operating activities less interests paid & received, repayment of lease liabilities & related interests
Net Debt (or financial net debt): Sum of long and short financial debt and associated derivatives, net of treasury and cash equivalents.
Average net debt: Average of monthly net debt at end of month.
Dividend pay-out: Dividend per share / Headline diluted EPS.
Consolidated income statement
(in millions of euros) |
2020 |
2019 |
|||
Net revenue1 |
|
9,712 |
9,800 |
||
Pass-through revenue |
|
1,076 |
1,201 |
||
Revenue |
|
10,788 |
11,001 |
||
Personnel costs Other operating costs |
|
(6,242) (2,388) |
(6,073) (2,683) |
||
Operating margin before depreciation and amortization |
|
2,158 |
2,245 |
||
Depreciation and amortization expense
|
|
(600) |
(586) |
||
Operating margin |
|
1,558 |
1,659 |
||
Amortization of intangibles from acquisitions |
|
(339) |
(204) |
||
Impairment |
|
(241) |
(209) |
||
Non-current income and expenses |
|
5 |
21 |
||
Operating income |
|
983 |
1,267 |
||
Financial expense Financial income Cost of net financial debt Revaluation of earn-out payments on acquisitions Other financial income and expenses |
|
(185) 66 (119) (17) (79) |
(137) 112 (25) (22) (66) |
||
Pre-tax income of consolidated companies |
|
768 |
1,154 |
||
Income taxes |
|
(196) |
(305) |
||
Net income of consolidated companies |
|
572 |
849 |
||
Share of profit of associates |
|
(1) |
(5) |
||
Net income |
|
571 |
844 |
||
Of which:
|
|
(5) |
3 |
||
Net income attributable to equity holders of the parent company |
|
576 |
841 |
||
Per share data (in euros) - Net income
|
||||
Number of shares |
239 838 347 |
|
234 293 034 |
|
Earnings per share |
2,40 |
|
3,59 |
|
|
|
|
|
|
Number of diluted shares |
241 926 553 |
|
236 608 597 |
|
Diluted earnings per share |
2,38 |
|
3,55 |
| ______________________ |
1 Net revenue: Revenue less pass-through costs. Those costs are mainly production & media costs and out-of-pocket expenses. As these items that can be passed on to clients are not included in the scope of analysis of transactions, the net revenue indicator is the most appropriate for measuring the Group’s operational performance. |
Consolidated statement of comprehensive income
(in millions of euros) |
|
2020 |
2019 |
|
Net income for the period (a) |
|
571 |
|
844 |
|
|
|
|
|
Comprehensive income that will not be reclassified to income statement |
|
|
|
|
|
|
|
||
- Actuarial gains (and losses) on defined benefit plans |
|
(20) |
|
(29) |
- Deferred taxes on comprehensive income that will not be reclassified to income statement |
|
3 |
|
5 |
|
|
|
||
Comprehensive income that may be reclassified to income statement |
|
|
|
|
|
|
|
||
- Remeasurement of hedging instruments |
|
(89) |
|
(84) |
- Consolidation translation adjustments |
|
(633) |
|
78 |
Total other comprehensive income (b) |
|
(739) |
|
(30) |
|
|
|
|
|
Total comprehensive income for the period (a) + (b) |
|
(168) |
|
814 |
Of which: |
|
|
|
|
- Total comprehensive income for the period attributable to non-controlling interests |
|
(7) |
|
3 |
|
|
|
||
- Total comprehensive income for the period attributable to equity holders of the parent company |
|
(161) |
|
811 |
Consolidated balance sheet
(in millions of euros) |
|
December 31, 2020 |
December 31, 2019 |
|
Assets |
|
|
|
|
Goodwill, net |
|
10,858 |
11,629 |
|
Intangible assets, net |
|
1,509 |
1,979 |
|
Right-of-use assets related to leases |
|
1,645 |
2,122 |
|
Property, plant and equipment, net |
|
626 |
720 |
|
Deferred tax assets |
|
137 |
143 |
|
Investments in associates |
|
24 |
32 |
|
Other financial assets |
|
232 |
218 |
|
Non-current assets |
|
15,031 |
16,843 |
|
Inventories and work-in-progress |
|
230 |
411 |
|
Trade receivables |
|
9,508 |
10,233 |
|
Contract assets |
|
889 |
1,002 |
|
Other current receivables and current assets |
|
803 |
757 |
|
Cash and cash equivalents |
|
3,700 |
3,413 |
|
Current assets |
|
15,130 |
15,816 |
|
|
|
|
|
|
Total assets |
|
30,161 |
32,659 |
Equity and liabilities |
|
|
|
|
Share capital |
|
99 |
96 |
|
Additional paid-in capital and retained earnings, Group share |
|
7,083 |
7,305 |
|
Equity attributable to holders of the parent company |
|
7,182 |
7,401 |
|
Non-controlling interests |
|
(22) |
(9) |
|
Total equity |
|
7,160 |
7,392 |
|
Long-term borrowings |
|
3,653 |
4,286 |
|
Long-term lease liabilities |
|
1,850 |
2,196 |
|
Deferred tax liabilities |
|
247 |
413 |
|
Long-term provisions |
|
468 |
426 |
|
Non-current liabilities |
|
6,218 |
7,321 |
|
Trade payables |
|
12,887 |
13,411 |
|
Lease liabilities |
|
404 |
353 |
|
Short-term borrowings |
|
856 |
1,602 |
|
Short-term lease liabilities |
|
292 |
336 |
|
Income taxes payable |
|
296 |
351 |
|
Short-term provisions |
|
234 |
170 |
|
Other creditors and current liabilities |
|
1,814 |
1,723 |
|
Current liabilities |
|
16,783 |
17,946 |
|
|
|
|
|
|
Total equity and liabilities |
|
30,161 |
32,659 |
Consolidated statement of cash flows
(in millions of euros) |
2020 |
2019 |
||
Cash flow from operating activities |
|
|
||
Net income |
571 |
844 |
||
Neutralization of non-cash income and expenses: |
|
|
||
Income taxes |
196 |
305 |
||
Cost of net financial debt |
119 |
25 |
||
Capital losses (gains) on disposal of assets (before tax) |
(6) |
(20) |
||
Depreciation, amortization and impairment loss |
1,180 |
999 |
||
Share-based compensation |
55 |
49 |
||
Other non-cash income and expenses |
94 |
88 |
||
Share of profit of associates |
1 |
5 |
||
Dividends received from associates |
2 |
2 |
||
Taxes paid |
(293) |
(349) |
||
Change in working capital requirements(1) |
1,047 |
394 |
||
Net cash flows generated by (used in) operating activities (I) |
2,966 |
2,342 |
||
Cash flow from investing activities |
|
|
||
Purchases of property, plant and equipment and intangible assets |
(167) |
(232) |
||
Disposals of property, plant and equipment and intangible assets |
12 |
7 |
||
Purchases of investments and other financial assets, net |
(9) |
20 |
||
Acquisitions of subsidiaries |
(146) |
(4,143) |
||
Disposals of subsidiaries |
1 |
88 |
||
Net cash flows generated by (used in) investing activities (II) |
(309) |
(4,260) |
||
Cash flow from financing activities |
|
|
||
Dividends paid to holders of the parent company |
(102) |
(285) |
||
Dividends paid to non-controlling interests |
(10) |
(12) |
||
Proceeds from borrowings |
2 |
3,413 |
||
Repayment of borrowings |
(1,302) |
(485) |
||
Repayment of lease liabilities |
(384) |
(403) |
||
Interest paid on lease liabilities |
(77) |
(77) |
||
Interest paid |
(184) |
(96) |
||
Interest received |
71 |
107 |
||
Buyouts of non-controlling interests |
(10) |
(40) |
||
Net (buybacks)/sales of treasury shares and warrants |
8 |
7 |
||
Net cash flows generated by (used in) financing activities (III) |
(1,988) |
2,129 |
||
Impact of exchange rate fluctuations (IV) |
(379) |
4 |
||
Change in consolidated cash and cash equivalents (I + II + III + IV) |
290 |
215 |
||
Cash and cash equivalents on January 1 |
3,413 |
3,206 |
||
Bank overdrafts on January 1 |
(6) |
(14) |
||
Net cash and cash equivalents at beginning of year (V) |
3,407 |
3,192 |
||
Cash and cash equivalents at closing date |
3,700 |
3,413 |
||
Bank overdrafts at closing date |
(3) |
(6) |
||
Net cash and cash equivalents at end of the year (VI) |
3,697 |
3,407 |
||
Change in consolidated cash and cash equivalents (VI – V) |
290 |
215 |
||
(1) Breakdown of change in working capital requirements |
|
|
||
Change in inventory and work-in-progress |
139 |
(14) |
||
Change in trade receivables and other receivables |
(24) |
(529) |
||
Change in accounts payable, other payables and provisions |
932 |
937 |
||
Change in working capital requirements |
1,047 |
394 |
Consolidated statement of changes in equity
Number of
|
(in millions of euros) |
Share
|
Additional
|
Reserves
|
Translation
|
Fair value
|
Equity
|
Minority
|
Total
|
|||||||||
236,956,827 |
January 1, 2020 |
96 |
4,137 |
3,240 |
(185) |
113 |
7,401 |
(9) |
7,392 |
|||||||||
|
Net income |
|
|
576 |
|
|
576 |
(5) |
571 |
|||||||||
|
Other comprehensive income, net of tax |
|
|
|
(631) |
(106) |
(737) |
(2) |
(739) |
|||||||||
|
Total comprehensive income for the year |
|
|
576 |
(631) |
(106) |
(161) |
(7) |
(168) |
|||||||||
7,035,496 |
Dividends |
3 |
169 |
(274) |
|
|
(102) |
(10) |
(112) |
|||||||||
274,325 |
Share-based compensation, net of tax |
|
|
56 |
|
|
56 |
|
56 |
|||||||||
|
Effect of acquisitions and commitments to buy out non-controlling interests |
|
|
(6) |
|
|
(6) |
4 |
(2) |
|||||||||
22,156 |
Equity warrant exercise |
|
1 |
|
|
|
1 |
|
1 |
|||||||||
1,288,975 |
(Buybacks)/sales of treasury shares |
|
|
(7) |
|
|
(7) |
|
(7) |
|||||||||
245,577,779 |
December 31, 2020 |
99 |
4,307 |
3,585 |
(816) |
7 |
7,182 |
(22) |
7,160 |
| Number of outstanding shares |
(in millions of euros) |
Share
|
|
Additional
|
|
Reserves
|
|
Translation
|
|
Fair value
|
|
Equity
|
|
Minority
|
|
Total
|
||
231,240,308 |
January 1, 2019 |
94 |
3 926 |
2,875 |
(263) |
221 |
6,853 |
- |
6,853 |
|||||||||
|
Net income |
|
|
841 |
|
|
841 |
3 |
844 |
|||||||||
|
Other comprehensive income, net of tax |
|
|
|
78 |
(108) |
(31) |
(0) |
(31) |
|||||||||
|
Total comprehensive income for the year |
|
|
841 |
78 |
(108) |
811 |
3 |
814 |
|||||||||
4,481,915 |
Dividends |
2 |
206 |
(493) |
|
|
(285) |
(12) |
(297) |
|||||||||
522,277 |
Share-based compensation, net of tax |
|
|
48 |
|
|
48 |
|
48 |
|||||||||
|
Effect of acquisitions and commitments to buy out non-controlling interests |
|
|
(40) |
|
|
(40) |
|
(40) |
|||||||||
183,068 |
Equity warrant exercise |
0 |
5 |
|
|
|
5 |
|
5 |
|||||||||
529,259 |
(Buybacks)/sales of treasury shares |
|
|
9 |
|
|
9 |
|
9 |
|||||||||
236,956,827 |
December 31, 2019 |
96 |
4,137 |
3,240 |
(185) |
113 |
7,401 |
(9) |
7,392 |
Earnings per share (basic and diluted)
(in millions of euros, except for share data) |
|
2020 |
2019 |
|||
Net income used for the calculation of earnings per share |
|
|
|
|||
Group net income |
A |
576 |
841 |
|||
Impact of dilutive instruments: |
|
|
|
|||
- Savings in financial expenses related to the conversion of debt instruments, net of tax |
|
- |
- |
|||
Group net income – diluted |
B |
576 |
841 |
|||
Number of shares used to calculate earnings per share |
|
|
|
|||
Number of shares at January 1 |
|
240 437 061 |
235,249,801 |
|||
Shares created over the year |
|
1 974 862 |
2,457,867 |
|||
Treasury shares to be deducted (average for the year) |
|
(2 573 576) |
(3,414,634) |
|||
Average number of shares used for the calculation |
C |
239 838 347 |
234,293,034 |
|||
Impact of dilutive instruments: |
|
|
|
|||
- Free shares and dilutive stock options(1) |
|
1 977 939 |
1,951,354 |
|||
- Equity warrants (BSA)(1) |
|
110 267 |
364,209 |
|||
Number of diluted shares |
D |
241 926 553 |
236,608,597 |
|||
(in euros) |
|
|
|
|||
Earnings per share |
A/C |
2,40 |
3.59 |
|||
|
|
|
|
|||
Diluted earnings per share |
B/D |
2,38 |
3.55 |
| (1) | Only stock options and warrants with a dilutive impact, i.e. whose strike price is lower than the average strike price, are included in the calculation. At December 31, 2020, unexercised stock-options were not taken into account because they were earnings accretive. |
Headline earnings per share (basic and diluted)
(in millions of euros, except for share data) |
|
2020 |
|
2019 |
||
Net income used to calculate headline earnings per share(1) |
|
|
|
|||
Group net income |
|
576 |
841 |
|||
Items excluded: |
|
|
|
|||
- Amortization of intangibles from acquisitions, net of tax |
|
254 |
153 |
|||
- Impairment loss(2), net of tax |
|
185 |
163 |
|||
- Main capital gains and losses on disposal of assets and fair value adjustment of financial assets, net of tax |
|
(9) |
(21) |
|||
- Epsilon acquisition-related costs, net of tax |
|
- |
30 |
|||
- Anticipated unwinding of swaps |
|
11 |
|
|||
- Revaluation of earn-out payments |
|
17 |
22 |
|||
Headline Group net income |
E |
1 034 |
1,188 |
|||
Impact of dilutive instruments: |
|
|
|
|||
- Savings in financial expenses related to the conversion of debt instruments, net of tax |
|
- |
- |
|||
Headline Group net income, diluted |
F |
1 034 |
1,188 |
|||
|
|
|
|
|||
Number of shares used to calculate earnings per share |
|
|
|
|||
Number of shares at January 1 |
|
240 437 061 |
235,249,801 |
|||
Shares created over the year |
|
1 974 862 |
2,457,867 |
|||
Treasury shares to be deducted (average for the year) |
|
(2 573 576) |
(3,414,634) |
|||
Average number of shares used for the calculation |
C |
239 838 347 |
234,293,034 |
|||
Impact of dilutive instruments: |
|
|
|
|||
- Free shares and dilutive stock options |
|
1 977 939 |
1,951,354 |
|||
- Equity warrants (BSA) |
|
110 267 |
364,209 |
|||
Number of diluted shares |
D |
241 926 553 |
236,608,597 |
|||
(in euros) |
|
|
|
|||
Headline earnings per share(1) |
E/C |
4,31 |
5.07 |
|||
|
|
|
|
|||
Headline earnings per share – diluted(1) |
F/D |
4,27 |
5.02 |
| (1) | EPS after elimination of impairment charges, amortization of intangibles from acquisitions, the main capital gains (or losses) on disposals of assets, change in the fair value of financial assets, the costs of the anticipated unwinding of cross-currency swaps (in 2020), the revaluation of earn-out costs and Epsilon transaction costs (in 2019). |
|
| (2) | This amount includes impairment losses on right-of-use assets related to leases for euro 170 million in 2020 and euro 95 million in 2019. |
View source version on businesswire.com: https://www.businesswire.com/news/home/20210202006197/en/


