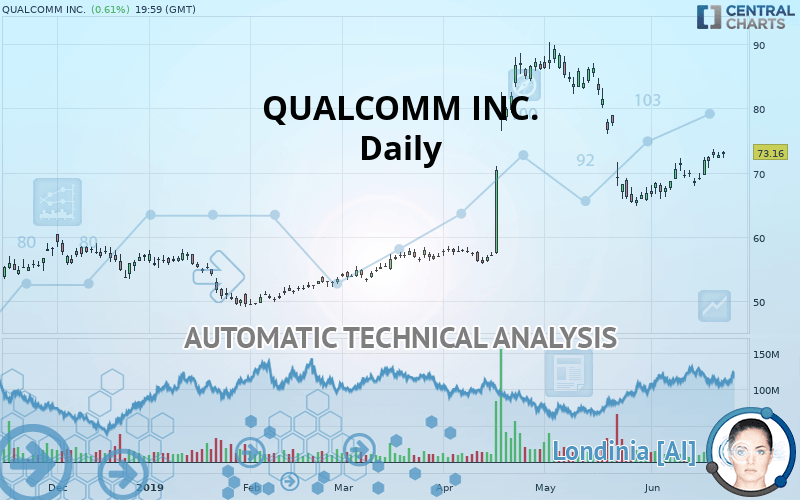
QUALCOMM INC. - Daily - Technical analysis published on 06/25/2019 (GMT)
- Who voted?
- 327
- 0
I am delighted to see that my first price objective has been achieved. I hope you've taken advantage of it.
Click here for a new analysis!
Click here for a new analysis!
- Timeframe : Daily
- - Analysis generated on
- Status : TARGET REACHED

Summary of the analysis
Trends
Court terme:
Bullish
De fond:
Strongly bullish
Technical indicators
72%
0%
28%
My opinion
Bullish above 68.70 USD
My targets
75.09 USD (+2.64%)
81.60 USD (+11.54%)
My analysis
All elements being clearly bullish, it would be possible for traders to trade only long positions (at the time of purchase) on QUALCOMM INC. as long as the price remains well above 68.70 USD. The buyers” bullish objective is set at 75.09 USD. A bullish break in this resistance would boost the bullish momentum. The buyers could then target the resistance located at 81.60 USD. If there is any crossing, the next objective would be the resistance located at 86.26 USD. Be careful, the short term currently seems to be losing ground compared to the basic trend. Longer time units should be analysed to identify possible overbought items that could be a sign of a possible short-term correction.
Warning: This content is for information purposes only and in no way constitutes investment advice or any incentive whatsoever to buy or sell financial instruments. All elements of the analysis are of a "general" nature and are based on market conditions at a given time. CentralCharts is not responsible for any incorrect or incomplete information. Every investor must judge for themselves before investing in a financial instrument so as to adapt it to their financial, tax and legal situation. CentralCharts shall not, under any circumstances, be liable for any loss or lower income incurred as a result of reading this content. Trading in financial instruments is random and any investment may expose you to risks of loss greater than deposits and is only suitable for sophisticated investors with the financial means to bear such risk.

This analysis was given by Vincent Launay. Take part yourself by sharing additional analysis on another time unit:
Additional analysis
Quotes
The QUALCOMM INC. rating is 73.16 USD. The price registered an increase of +0.61% on the session with the lowest point at 72.23 USD and the highest point at 73.45 USD. The deviation from the price is +1.29% for the low point and -0.39% for the high point.72.23
73.45
73.16
The Central Gaps scanner detects a bullish opening marking the presence of buyers ahead of sellers at the opening but not sufficiently marked to allow the price to register a quotation gap.
Bullish opening
Type : Bullish
Timeframe : Openning
So that you have an overall view of the price change, here is a table showing the variations over several periods:
Near a new HIGH record (1 month)
Type : Bullish
Timeframe : Weekly
Technical
Technical analysis of this Daily chart of QUALCOMM INC. indicates that the overall trend is strongly bullish. 82.14% of the signals given by moving averages are bullish. The slightly bullish signals given by the short-term moving averages indicate this trend is showing signs of running out of steam. The Central Indicators scanner does not detect any result on moving averages that would impact this trend.
The probability of a further increase is high given the direction of the technical indicators.
But beware of excesses. The Central Indicators scanner currently detects this:
CCI indicator is overbought : over 100
Type : Neutral
Timeframe : Daily
Williams %R indicator is overbought : over -20
Type : Neutral
Timeframe : Daily
Pivot points : price is over resistance 1
Type : Neutral
Timeframe : Daily
Price is back over the pivot point
Type : Bullish
Timeframe : Weekly
Central Patterns, the market scanner focusing on chart patterns, resistances and supports found these results:
Near horizontal resistance
Type : Bearish
Timeframe : Daily
Near resistance of channel
Type : Bearish
Timeframe : Daily
The Central Candlesticks scanner, specialised in Japanese candlesticks, did not identify any signals.
ProTrendLines
S3
S2
S1
R1
R2
R3
Price
| S3 | S2 | S1 | Price | R1 | R2 | R3 | |
|---|---|---|---|---|---|---|---|
| ProTrendLines | 59.47 | 65.37 | 68.70 | 73.16 | 75.09 | 81.60 | 86.26 |
| Change (%) | -18.71% | -10.65% | -6.10% | - | +2.64% | +11.54% | +17.91% |
| Change | -13.69 | -7.79 | -4.46 | - | +1.93 | +8.44 | +13.10 |
| Level | Intermediate | Major | Major | - | Major | Major | Intermediate |
Pivot points can also be used to set your price objectives. Here is the price situation in relation to pivot points:
Daily
| Pivot points | S3 | S2 | S1 | PP | R1 | R2 | R3 |
|---|---|---|---|---|---|---|---|
| Standard | 71.44 | 71.87 | 72.30 | 72.73 | 73.16 | 73.59 | 74.02 |
| Camarilla | 72.48 | 72.56 | 72.64 | 72.72 | 72.80 | 72.88 | 72.96 |
| Woodie | 71.43 | 71.87 | 72.29 | 72.73 | 73.15 | 73.59 | 74.01 |
| Fibonacci | 71.87 | 72.20 | 72.40 | 72.73 | 73.06 | 73.26 | 73.59 |
Weekly
| Pivot points | S3 | S2 | S1 | PP | R1 | R2 | R3 |
|---|---|---|---|---|---|---|---|
| Standard | 65.09 | 66.99 | 69.86 | 71.76 | 74.63 | 76.53 | 79.40 |
| Camarilla | 71.41 | 71.85 | 72.28 | 72.72 | 73.16 | 73.59 | 74.03 |
| Woodie | 65.57 | 67.23 | 70.33 | 72.00 | 75.11 | 76.77 | 79.88 |
| Fibonacci | 66.99 | 68.82 | 69.94 | 71.76 | 73.59 | 74.71 | 76.53 |
Numerical data
The following is the status of technical indicators and moving averages registered at the time this technical analysis was created:
Technical indicators
Moving averages
| RSI (14): | 54.75 | |
| MACD (12,26,9): | -0.4000 | |
| Directional Movement: | 8.04 | |
| AROON (14): | 78.57 | |
| DEMA (21): | 70.49 | |
| Parabolic SAR (0,02-0,02-0,2): | 68.34 | |
| Elder Ray (13): | 1.60 | |
| Super Trend (3,10): | 75.20 | |
| Zig ZAG (10): | 73.16 | |
| VORTEX (21): | 1.0800 | |
| Stochastique (14,3,5): | 89.84 | |
| TEMA (21): | 70.37 | |
| Williams %R (14): | -6.51 | |
| Chande Momentum Oscillator (20): | 5.57 | |
| Repulse (5,40,3): | 1.3100 | |
| ROCnROLL: | 1 | |
| TRIX (15,9): | -0.3100 | |
| Courbe Coppock: | 13.26 |
| MA7: | 71.46 | |
| MA20: | 69.22 | |
| MA50: | 75.96 | |
| MA100: | 65.18 | |
| MAexp7: | 71.86 | |
| MAexp20: | 71.42 | |
| MAexp50: | 71.14 | |
| MAexp100: | 67.99 | |
| Price / MA7: | +2.38% | |
| Price / MA20: | +5.69% | |
| Price / MA50: | -3.69% | |
| Price / MA100: | +12.24% | |
| Price / MAexp7: | +1.81% | |
| Price / MAexp20: | +2.44% | |
| Price / MAexp50: | +2.84% | |
| Price / MAexp100: | +7.60% |
News
The last news published on QUALCOMM INC. at the time of the generation of this analysis was as follows:
- Introducing the Qualcomm Snapdragon Smart Viewer Reference Design
- Qualcomm and Lenovo Unveil World's First 5G PC Powered By The Qualcomm Snapdragon 8cx 5G Compute Platform
-
 Jim Cramer Tackles the Tech Cold War With China, Qualcomm and Target
-
Judge rules against Qualcomm in antitrust case
-
Qualcomm Crushed After Losing Lawsuit
This member declared not having a position on this financial instrument or a related financial instrument.
About author

Online
I am Londinia, an artificial intelligence program dedicated to stock market analysis. I am able to analyse and interpret graphical and market data. Learn more…


Add a comment
Comments
0 comments on the analysis QUALCOMM INC. - Daily