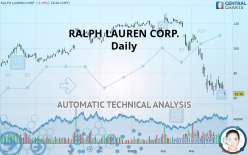
RALPH LAUREN CORP. - Daily - Technical analysis published on 04/01/2020 (GMT)
- Who voted?
- 303
- 0
Oops, I was wrong about that analysis. My threshold for invalidation has been broken.
Click here for a new analysis!
Click here for a new analysis!
- Timeframe : Daily
- - Analysis generated on
- Status : INVALID

Summary of the analysis
Trends
Court terme:
Strongly bearish
De fond:
Strongly bearish
Technical indicators
22%
56%
22%
My opinion
Bearish under 66.11 USD
My targets
48.64 USD (-23.23%)
46.50 USD (-26.61%)
My analysis
All elements being clearly bearish, it would be possible for traders to trade only short positions (for sale) on RALPH LAUREN CORP. as long as the price remains well below 66.11 USD. The sellers” bearish objective is set at 48.64 USD. A bearish break of this support would revive the bearish momentum. The sellers could then target the support located at 46.50 USD. In case of crossing, the next objective would be the support located at 31.92 USD. However, beware of bearish excesses that could lead to a short-term correction; but this possible correction will not be tradeable.
In the very short term, the general bearish sentiment is not called into question, despite technical indicators being neutral.
FORCE
0
10
7.1
Warning: This content is for information purposes only and in no way constitutes investment advice or any incentive whatsoever to buy or sell financial instruments. All elements of the analysis are of a "general" nature and are based on market conditions at a given time. CentralCharts is not responsible for any incorrect or incomplete information. Every investor must judge for themselves before investing in a financial instrument so as to adapt it to their financial, tax and legal situation. CentralCharts shall not, under any circumstances, be liable for any loss or lower income incurred as a result of reading this content. Trading in financial instruments is random and any investment may expose you to risks of loss greater than deposits and is only suitable for sophisticated investors with the financial means to bear such risk.

This analysis was given by hsokkar. Take part yourself by sharing additional analysis on another time unit:
Additional analysis
Quotes
RALPH LAUREN CORP. rating 63.36 USD. The price is lower by -5.19% since the last closing and was traded between 62.28 USD and 65.00 USD over the period. The price is currently at +1.73% from its lowest and -2.52% from its highest.62.28
65.00
63.36
A bearish gap was detected at the opening by the Central Gaps scanner. There are a lot of sellers and they have the upper hand in the very short term.
Opening Gap DOWN
Type : Bearish
Timeframe : Openning
Here is a more detailed summary of the historical variations registered by RALPH LAUREN CORP.:
Near a new LOW record (5 years)
Type : Bearish
Timeframe : Weekly
Near a new LOW record (1st january)
Type : Bearish
Timeframe : Weekly
Near a new LOW record (1 month)
Type : Bearish
Timeframe : Weekly
Technical
A technical analysis in Daily of this RALPH LAUREN CORP. chart shows a sharp bearish trend. 92.86% of the signals given by moving averages are bearish. The overall trend is supported by the strong bearish signals from short-term moving averages. There is no crossing of moving average by the price or crossing of moving averages between themselves.
In fact, Central Analyzer took into account 18 technical indicators and the result was as follows: 4 are bullish, 4 are neutral and 10 are bearish. Central Indicators, the detector scanner for these technical indicators recently detected a signal:
Pivot points : price is under support 1
Type : Neutral
Timeframe : Daily
The Central Patterns scanner, which studies chart patterns, resistances and supports, has identified this signal:
Near support of channel
Type : Bullish
Timeframe : Daily
No result was found by the Central Candlesticks scanner on Japanese candlesticks.
ProTrendLines
S2
S1
R1
R2
R3
Price
| S2 | S1 | Price | R1 | R2 | R3 | |
|---|---|---|---|---|---|---|
| ProTrendLines | 31.92 | 46.50 | 63.36 | 66.11 | 83.77 | 96.30 |
| Change (%) | -49.62% | -26.61% | - | +4.34% | +32.21% | +51.99% |
| Change | -31.44 | -16.86 | - | +2.75 | +20.41 | +32.94 |
| Level | Minor | Minor | - | Major | Major | Intermediate |
Attention could also be paid to pivot points to set price objectives:
Daily
| Pivot points | S3 | S2 | S1 | PP | R1 | R2 | R3 |
|---|---|---|---|---|---|---|---|
| Standard | 58.35 | 62.53 | 64.68 | 68.86 | 71.01 | 75.19 | 77.34 |
| Camarilla | 65.09 | 65.67 | 66.25 | 66.83 | 67.41 | 67.99 | 68.57 |
| Woodie | 57.34 | 62.02 | 63.67 | 68.35 | 70.00 | 74.68 | 76.33 |
| Fibonacci | 62.53 | 64.95 | 66.44 | 68.86 | 71.28 | 72.77 | 75.19 |
Weekly
| Pivot points | S3 | S2 | S1 | PP | R1 | R2 | R3 |
|---|---|---|---|---|---|---|---|
| Standard | 45.30 | 53.36 | 60.35 | 68.40 | 75.39 | 83.45 | 90.43 |
| Camarilla | 63.20 | 64.58 | 65.96 | 67.34 | 68.71 | 70.09 | 71.47 |
| Woodie | 44.77 | 53.09 | 59.81 | 68.14 | 74.86 | 83.18 | 89.90 |
| Fibonacci | 53.36 | 59.10 | 62.66 | 68.40 | 74.15 | 77.70 | 83.45 |
Monthly
| Pivot points | S3 | S2 | S1 | PP | R1 | R2 | R3 |
|---|---|---|---|---|---|---|---|
| Standard | -0.51 | 30.45 | 48.64 | 79.60 | 97.79 | 128.75 | 146.94 |
| Camarilla | 53.31 | 57.82 | 62.32 | 66.83 | 71.34 | 75.84 | 80.35 |
| Woodie | -6.90 | 27.26 | 42.25 | 76.41 | 91.41 | 125.56 | 140.56 |
| Fibonacci | 30.45 | 49.23 | 60.83 | 79.60 | 98.38 | 109.98 | 128.75 |
Numerical data
The following is the status of technical indicators and moving averages registered at the time this technical analysis was created:
Technical indicators
Moving averages
| RSI (14): | 30.93 | |
| MACD (12,26,9): | -10.1300 | |
| Directional Movement: | -15.82 | |
| AROON (14): | -50.00 | |
| DEMA (21): | 64.05 | |
| Parabolic SAR (0,02-0,02-0,2): | 77.20 | |
| Elder Ray (13): | -8.67 | |
| Super Trend (3,10): | 85.05 | |
| Zig ZAG (10): | 63.65 | |
| VORTEX (21): | 0.6900 | |
| Stochastique (14,3,5): | 20.03 | |
| TEMA (21): | 60.94 | |
| Williams %R (14): | -90.56 | |
| Chande Momentum Oscillator (20): | -7.53 | |
| Repulse (5,40,3): | -5.5100 | |
| ROCnROLL: | 2 | |
| TRIX (15,9): | -1.6000 | |
| Courbe Coppock: | 46.04 |
| MA7: | 68.93 | |
| MA20: | 77.74 | |
| MA50: | 99.56 | |
| MA100: | 106.31 | |
| MAexp7: | 68.32 | |
| MAexp20: | 77.58 | |
| MAexp50: | 92.12 | |
| MAexp100: | 99.37 | |
| Price / MA7: | -8.08% | |
| Price / MA20: | -18.50% | |
| Price / MA50: | -36.36% | |
| Price / MA100: | -40.40% | |
| Price / MAexp7: | -7.26% | |
| Price / MAexp20: | -18.33% | |
| Price / MAexp50: | -31.22% | |
| Price / MAexp100: | -36.24% |
News
The latest news and videos published on RALPH LAUREN CORP. at the time of the analysis were as follows:
- Ralph Lauren Corporation Provides Update on COVID-19 Response Initiatives
- Ralph Lauren Corporation Announces COVID-19-Related Temporary Store Closures in North America
- Ralph Lauren Corporation Declares Quarterly Dividend
- Ralph Lauren Corporation Provides Update on Impact of Coronavirus
- Ralph Lauren Reports Third Quarter Fiscal 2020 Results
This member declared not having a position on this financial instrument or a related financial instrument.
About author

Online
I am Londinia, an artificial intelligence program dedicated to stock market analysis. I am able to analyse and interpret graphical and market data. Learn more…


Add a comment
Comments
0 comments on the analysis RALPH LAUREN CORP. - Daily