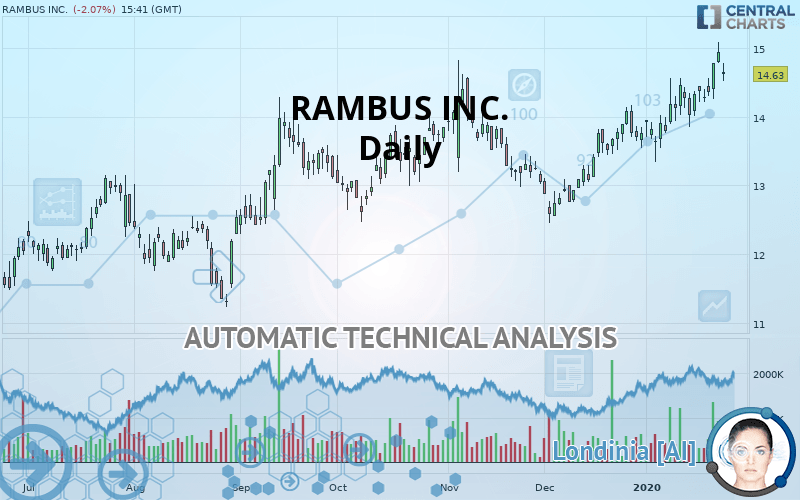
RAMBUS INC. - Daily - Technical analysis published on 01/27/2020 (GMT)
- Who voted?
- 238
- 0
Click here for a new analysis!
- Timeframe : Daily
- - Analysis generated on
- Status : TARGET REACHED

Summary of the analysis

Additional analysis
Quotes
The RAMBUS INC. rating is 14.63 USD. The price has increased by -2.08% since the last closing and was traded between 14.52 USD and 14.78 USD over the period. The price is currently at +0.76% from its lowest and -1.01% from its highest.The Central Gaps scanner detects a bearish gap which is a sign that the sellers have taken the lead in the very short term.
Opening Gap DOWN
Type : Bearish
Timeframe : Openning
Here is a more detailed summary of the historical variations registered by RAMBUS INC.:
Near a new HIGH record (5 years)
Type : Bullish
Timeframe : Weekly
Near a new HIGH record (1 year)
Type : Bullish
Timeframe : Weekly
Near a new HIGH record (1st january)
Type : Bullish
Timeframe : Weekly
Near a new HIGH record (1 month)
Type : Bullish
Timeframe : Weekly
Technical
Technical analysis of RAMBUS INC. in Daily shows a strongly overall bullish trend. The signals given by the moving averages are 92.86% bullish. This strong bullish trend is confirmed by the strong signals currently being given by short-term moving averages. The Central Indicators market scanner currently does not detect any result that concerns moving averages.
An assessment of technical indicators shows a strong bullish signal.
Caution: the Central Indicators scanner currently detects an excess:
CCI indicator is overbought : over 100
Type : Neutral
Timeframe : Daily
Williams %R indicator is overbought : over -20
Type : Neutral
Timeframe : Daily
Pivot points : price is under support 1
Type : Neutral
Timeframe : Daily
Price is back over the pivot point
Type : Bullish
Timeframe : Daily
Price is back over the pivot point
Type : Bullish
Timeframe : Weekly
Central Patterns, the market scanner focusing on chart patterns, resistances and supports found this result:
Resistance of channel is broken
Type : Bullish
Timeframe : Daily
No result was found by the Central Candlesticks scanner on Japanese candlesticks.
| S3 | S2 | S1 | Price | R1 | R2 | R3 | |
|---|---|---|---|---|---|---|---|
| ProTrendLines | 12.59 | 13.24 | 14.42 | 14.63 | 15.42 | 25.01 | 35.20 |
| Change (%) | -13.94% | -9.50% | -1.44% | - | +5.40% | +70.95% | +140.60% |
| Change | -2.04 | -1.39 | -0.21 | - | +0.79 | +10.38 | +20.57 |
| Level | Intermediate | Intermediate | Major | - | Major | Minor | Minor |
Attention could also be paid to pivot points to set price objectives:
| Pivot points | S3 | S2 | S1 | PP | R1 | R2 | R3 |
|---|---|---|---|---|---|---|---|
| Standard | 14.47 | 14.63 | 14.78 | 14.94 | 15.09 | 15.25 | 15.40 |
| Camarilla | 14.86 | 14.88 | 14.91 | 14.94 | 14.97 | 15.00 | 15.03 |
| Woodie | 14.48 | 14.63 | 14.79 | 14.94 | 15.10 | 15.25 | 15.41 |
| Fibonacci | 14.63 | 14.75 | 14.82 | 14.94 | 15.06 | 15.13 | 15.25 |
| Pivot points | S3 | S2 | S1 | PP | R1 | R2 | R3 |
|---|---|---|---|---|---|---|---|
| Standard | 13.54 | 13.88 | 14.41 | 14.75 | 15.28 | 15.62 | 16.15 |
| Camarilla | 14.70 | 14.78 | 14.86 | 14.94 | 15.02 | 15.10 | 15.18 |
| Woodie | 13.64 | 13.93 | 14.51 | 14.80 | 15.38 | 15.67 | 16.25 |
| Fibonacci | 13.88 | 14.21 | 14.42 | 14.75 | 15.08 | 15.29 | 15.62 |
| Pivot points | S3 | S2 | S1 | PP | R1 | R2 | R3 |
|---|---|---|---|---|---|---|---|
| Standard | 11.04 | 11.75 | 12.76 | 13.47 | 14.48 | 15.19 | 16.20 |
| Camarilla | 13.30 | 13.46 | 13.62 | 13.78 | 13.93 | 14.09 | 14.25 |
| Woodie | 11.20 | 11.82 | 12.92 | 13.54 | 14.64 | 15.26 | 16.36 |
| Fibonacci | 11.75 | 12.40 | 12.81 | 13.47 | 14.12 | 14.53 | 15.19 |
Numerical data
The following is the status of technical indicators and moving averages registered at the time this technical analysis was created:
| RSI (14): | 61.39 | |
| MACD (12,26,9): | 0.3000 | |
| Directional Movement: | 14.71 | |
| AROON (14): | 92.86 | |
| DEMA (21): | 14.59 | |
| Parabolic SAR (0,02-0,02-0,2): | 13.86 | |
| Elder Ray (13): | 0.27 | |
| Super Trend (3,10): | 13.86 | |
| Zig ZAG (10): | 14.65 | |
| VORTEX (21): | 1.0600 | |
| Stochastique (14,3,5): | 86.96 | |
| TEMA (21): | 14.74 | |
| Williams %R (14): | -29.22 | |
| Chande Momentum Oscillator (20): | 0.85 | |
| Repulse (5,40,3): | 1.8300 | |
| ROCnROLL: | 1 | |
| TRIX (15,9): | 0.2600 | |
| Courbe Coppock: | 10.15 |
| MA7: | 14.53 | |
| MA20: | 14.16 | |
| MA50: | 13.65 | |
| MA100: | 13.53 | |
| MAexp7: | 14.55 | |
| MAexp20: | 14.22 | |
| MAexp50: | 13.84 | |
| MAexp100: | 13.43 | |
| Price / MA7: | +0.69% | |
| Price / MA20: | +3.32% | |
| Price / MA50: | +7.18% | |
| Price / MA100: | +8.13% | |
| Price / MAexp7: | +0.55% | |
| Price / MAexp20: | +2.88% | |
| Price / MAexp50: | +5.71% | |
| Price / MAexp100: | +8.94% |
News
The latest news and videos published on RAMBUS INC. at the time of the analysis were as follows:
- Media Alert: Rambus Presents Solutions for AI, 5G and Data Center Applications at DesignCon in Santa Clara, CA
- Media Alert: Rambus To Announce Fourth Quarter And Fiscal Year 2019 Results
- Media Alert: Rambus to Present at 22nd Annual Needham Growth Conference
- Enflame Technology Selects Rambus HBM2 Memory Subsystem Solution For Next-Generation AI Training Chip
- Rambus Completes Acquisition of the Verimatrix Silicon IP, Secure Protocols and Provisioning Business
About author

Online


Add a comment
Comments
0 comments on the analysis RAMBUS INC. - Daily