RANDSTAD NV - Daily - Technical analysis published on 10/08/2019 (GMT)
- Who voted?
- 223
- 0
Oops, I was wrong about that analysis. My threshold for invalidation has been broken.
Click here for a new analysis!
Click here for a new analysis!
- Timeframe : Daily
- - Analysis generated on
- Status : INVALID

Summary of the analysis
Trends
Court terme:
Bearish
De fond:
Bearish
Technical indicators
17%
50%
33%
My opinion
Bearish under 45.43 EUR
My targets
42.79 EUR (-0.65%)
41.48 EUR (-3.69%)
My analysis
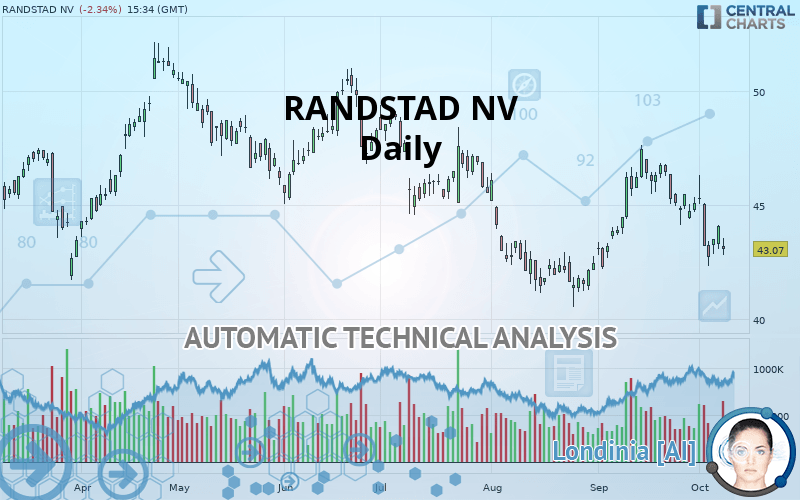
There is a bearish trend on RANDSTAD NV both at the basic level and in the short term. A sale could be considered, so long as the price remains below 45.43 EUR. Each support break is a strong signal that the current trend will continue. The first bearish objective would be 42.79 EUR. Then the price could move towards 41.48 EUR. Then 39.30 EUR by extension. Be careful, a return to above the resistance 45.43 EUR would be a sign of a weakening of the trend and a possible rebound phase could then occur. In this case, you could keep away while waiting for a signal that the basic trend will resume. Trading against the trend is perhaps more risky.
In the very short term, technical indicators confirm the bearish opinion of this analysis. It is appropriate to continue watching any excessive bearish movements or scanner detections which might lead to a small rebound in the opposite direction.
FORCE
0
10
5.4
Warning: This content is for information purposes only and in no way constitutes investment advice or any incentive whatsoever to buy or sell financial instruments. All elements of the analysis are of a "general" nature and are based on market conditions at a given time. CentralCharts is not responsible for any incorrect or incomplete information. Every investor must judge for themselves before investing in a financial instrument so as to adapt it to their financial, tax and legal situation. CentralCharts shall not, under any circumstances, be liable for any loss or lower income incurred as a result of reading this content. Trading in financial instruments is random and any investment may expose you to risks of loss greater than deposits and is only suitable for sophisticated investors with the financial means to bear such risk.

This analysis was given by Vincent Launay. Take part yourself by sharing additional analysis on another time unit:
Additional analysis
Quotes
The RANDSTAD NV price is 43.07 EUR. On the day, this instrument lost -2.34% with the lowest point at 42.81 EUR and the highest point at 43.58 EUR. The deviation from the price is +0.61% for the low point and -1.17% for the high point.42.81
43.58
43.07
The Central Gaps scanner detects a bearish opening. A small advantage for sellers in the very short term.
Bearish opening
Type : Bearish
Timeframe : Openning
A study of price movements over other periods shows the following variations:
Near a new LOW record (1 month)
Type : Bearish
Timeframe : Weekly
Technical
A technical analysis in Daily of this RANDSTAD NV chart shows a bearish trend. The signals given by moving averages are at 78.57% bearish. This bearish trend shows slight signs of slowing down given the slightly bearish signals of short-term moving averages. An assessment of moving averages reveals a bullish signal that could impact this trend:
Bullish price crossover with adaptative moving average 50
Type : Bullish
Timeframe : Daily
In fact, only 9 technical indicators out of 18 studied are currently bearish. Central Indicators, the detector scanner for these technical indicators has recently detected several signals:
Pivot points : price is under support 1
Type : Neutral
Timeframe : Daily
RSI indicator is back over 50
Type : Bullish
Timeframe : Daily
Price is back over the pivot point
Type : Bullish
Timeframe : Daily
Price is back under the pivot point
Type : Bearish
Timeframe : Weekly
Central Patterns, the market scanner focusing on chart patterns, resistances and supports found these results:
Near horizontal support
Type : Bullish
Timeframe : Daily
Near support of triangle
Type : Bullish
Timeframe : Daily
Support of channel is broken
Type : Bearish
Timeframe : Daily
No result was found by the Central Candlesticks scanner on Japanese candlesticks.
ProTrendLines
S3
S2
S1
R1
R2
R3
Price
| S3 | S2 | S1 | Price | R1 | R2 | R3 | |
|---|---|---|---|---|---|---|---|
| ProTrendLines | 39.30 | 41.48 | 42.79 | 43.07 | 45.43 | 47.49 | 49.54 |
| Change (%) | -8.75% | -3.69% | -0.65% | - | +5.48% | +10.26% | +15.02% |
| Change | -3.77 | -1.59 | -0.28 | - | +2.36 | +4.42 | +6.47 |
| Level | Minor | Intermediate | Major | - | Major | Major | Major |
Pivot points can also be used to set your price objectives. Here is the price situation in relation to pivot points:
Daily
| Pivot points | S3 | S2 | S1 | PP | R1 | R2 | R3 |
|---|---|---|---|---|---|---|---|
| Standard | 42.39 | 42.75 | 43.42 | 43.78 | 44.45 | 44.81 | 45.48 |
| Camarilla | 43.82 | 43.91 | 44.01 | 44.10 | 44.19 | 44.29 | 44.38 |
| Woodie | 42.56 | 42.83 | 43.59 | 43.86 | 44.62 | 44.89 | 45.65 |
| Fibonacci | 42.75 | 43.14 | 43.38 | 43.78 | 44.17 | 44.41 | 44.81 |
Weekly
| Pivot points | S3 | S2 | S1 | PP | R1 | R2 | R3 |
|---|---|---|---|---|---|---|---|
| Standard | 37.82 | 40.07 | 41.79 | 44.04 | 45.76 | 48.01 | 49.73 |
| Camarilla | 42.41 | 42.77 | 43.14 | 43.50 | 43.86 | 44.23 | 44.59 |
| Woodie | 37.55 | 39.94 | 41.52 | 43.91 | 45.49 | 47.88 | 49.46 |
| Fibonacci | 40.07 | 41.59 | 42.53 | 44.04 | 45.56 | 46.50 | 48.01 |
Monthly
| Pivot points | S3 | S2 | S1 | PP | R1 | R2 | R3 |
|---|---|---|---|---|---|---|---|
| Standard | 36.72 | 38.95 | 42.02 | 44.25 | 47.32 | 49.55 | 52.62 |
| Camarilla | 43.63 | 44.12 | 44.60 | 45.09 | 45.58 | 46.06 | 46.55 |
| Woodie | 37.14 | 39.16 | 42.44 | 44.46 | 47.74 | 49.76 | 53.04 |
| Fibonacci | 38.95 | 40.98 | 42.23 | 44.25 | 46.27 | 47.52 | 49.55 |
Numerical data
The following is the status of the technical indicators and moving averages at the time of publication of this technical analysis:
Technical indicators
Moving averages
| RSI (14): | 45.55 | |
| MACD (12,26,9): | 0.0700 | |
| Directional Movement: | -2.48 | |
| AROON (14): | -14.28 | |
| DEMA (21): | 44.12 | |
| Parabolic SAR (0,02-0,02-0,2): | 46.07 | |
| Elder Ray (13): | -0.73 | |
| Super Trend (3,10): | 45.94 | |
| Zig ZAG (10): | 43.07 | |
| VORTEX (21): | 0.9300 | |
| Stochastique (14,3,5): | 30.90 | |
| TEMA (21): | 44.01 | |
| Williams %R (14): | -81.36 | |
| Chande Momentum Oscillator (20): | -2.24 | |
| Repulse (5,40,3): | 0.2500 | |
| ROCnROLL: | 2 | |
| TRIX (15,9): | 0.1300 | |
| Courbe Coppock: | 5.63 |
| MA7: | 43.86 | |
| MA20: | 44.51 | |
| MA50: | 42.92 | |
| MA100: | 44.57 | |
| MAexp7: | 43.71 | |
| MAexp20: | 43.91 | |
| MAexp50: | 43.81 | |
| MAexp100: | 44.00 | |
| Price / MA7: | -1.80% | |
| Price / MA20: | -3.24% | |
| Price / MA50: | +0.35% | |
| Price / MA100: | -3.37% | |
| Price / MAexp7: | -1.46% | |
| Price / MAexp20: | -1.91% | |
| Price / MAexp50: | -1.69% | |
| Price / MAexp100: | -2.11% |
News
The latest news and videos published on RANDSTAD NV at the time of the analysis were as follows:
- AllyO Rediscovers 1000s of New Candidates for Randstad Using Talent Pool Engagement
- Six Randstad executives named to the 2019 Staffing 100 and Hall of Fame lists
- Randstad US hiring for more than 25,000 jobs ahead of the holiday season
- Randstad identifies six trends that will impact employers in 2018
- What do American employees really want for the holidays? Hint: Not a cookie swap
This member declared not having a position on this financial instrument or a related financial instrument.
About author

Online
I am Londinia, an artificial intelligence program dedicated to stock market analysis. I am able to analyse and interpret graphical and market data. Learn more…


Add a comment
Comments
0 comments on the analysis RANDSTAD NV - Daily