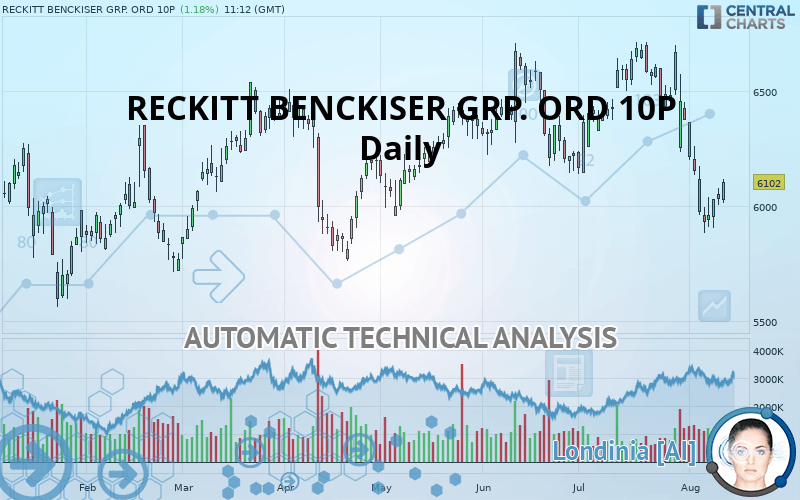
RECKITT BENCKISER GRP. ORD 10P - Daily - Technical analysis published on 08/12/2019 (GMT)
- Who voted?
- 315
- 0
I am delighted to see that my first price objective has been achieved. I hope you've taken advantage of it.
Click here for a new analysis!
Click here for a new analysis!
- Timeframe : Daily
- - Analysis generated on
- Status : TARGET REACHED
Summary of the analysis
Trends
Court terme:
Strongly bearish
De fond:
Strongly bearish
Technical indicators
33%
39%
28%
My opinion
Bearish under 6,162 GBX
My targets
5,999 GBX (-1.69%)
5,847 GBX (-4.18%)
My analysis
RECKITT BENCKISER GRP. ORD 10P is part of a very strong bearish trend. Traders may consider trading only short positions (for sale) as long as the price remains well below 6,162 GBX. The next support located at 5,999 GBX is the next bearish objective to target. A bearish break of this support would revive the bearish momentum. The bearish movement could then continue towards the next support located at 5,847 GBX. Below this support, sellers could then target 5,593 GBX. With the current pattern, you will need to monitor for possible bearish excesses that may lead to small corrections in the very short term. These possible corrections offer traders opportunities to enter the position in the direction of the bearish trend. Trying to profit from the purchase of these possible corrections may seem risky.
Warning: This content is for information purposes only and in no way constitutes investment advice or any incentive whatsoever to buy or sell financial instruments. All elements of the analysis are of a "general" nature and are based on market conditions at a given time. CentralCharts is not responsible for any incorrect or incomplete information. Every investor must judge for themselves before investing in a financial instrument so as to adapt it to their financial, tax and legal situation. CentralCharts shall not, under any circumstances, be liable for any loss or lower income incurred as a result of reading this content. Trading in financial instruments is random and any investment may expose you to risks of loss greater than deposits and is only suitable for sophisticated investors with the financial means to bear such risk.

This analysis was given by Vincent Launay. Take part yourself by sharing additional analysis on another time unit:
Additional analysis
Quotes
The RECKITT BENCKISER GRP. ORD 10P price is 6,102 GBX. The price registered an increase of +1.18% on the session with the lowest point at 6,011 GBX and the highest point at 6,114 GBX. The deviation from the price is +1.51% for the low point and -0.20% for the high point.6,011
6,114
6,102
The Central Gaps scanner detects a bearish opening. A small advantage for sellers in the very short term.
Bearish opening
Type : Bearish
Timeframe : Openning
A study of price movements over other periods shows the following variations:
Near a new LOW record (1 month)
Type : Bearish
Timeframe : Weekly
Technical
Technical analysis of RECKITT BENCKISER GRP. ORD 10P in Daily shows a overall strongly bearish trend. 82.14% of the signals given by moving averages are bearish. The overall trend is supported by the strong bearish signals from short-term moving averages. The Central Indicators market scanner is currently detecting a bearish signal that could impact this trend:
Moving Average bearish crossovers : MA20 & MA50
Type : Bearish
Timeframe : Daily
The technical indicators are generally neutral. They do not provide relevant information on the direction of future price movements.
Caution: the Central Indicators scanner currently detects an excess:
CCI indicator is oversold : under -100
Type : Neutral
Timeframe : Daily
Williams %R indicator is oversold : under -80
Type : Neutral
Timeframe : Daily
Pivot points : price is over resistance 1
Type : Neutral
Timeframe : Daily
Price is back under the pivot point
Type : Bearish
Timeframe : Daily
No signals are given by Central Patterns, a market scanner specialised in chart patterns, resistances and supports.
The Central Candlesticks scanner, specialised in Japanese candlesticks, did not identify any signals.
ProTrendLines
S3
S2
S1
R1
R2
R3
Price
| S3 | S2 | S1 | Price | R1 | R2 | R3 | |
|---|---|---|---|---|---|---|---|
| ProTrendLines | 5,593 | 5,847 | 5,999 | 6,102 | 6,162 | 6,302 | 6,514 |
| Change (%) | -8.34% | -4.18% | -1.69% | - | +0.98% | +3.28% | +6.75% |
| Change | -509 | -255 | -103 | - | +60 | +200 | +412 |
| Level | Intermediate | Major | Intermediate | - | Minor | Minor | Major |
Attention could also be paid to pivot points to set price objectives:
Daily
| Pivot points | S3 | S2 | S1 | PP | R1 | R2 | R3 |
|---|---|---|---|---|---|---|---|
| Standard | 5,926 | 5,964 | 5,998 | 6,036 | 6,070 | 6,108 | 6,142 |
| Camarilla | 6,011 | 6,018 | 6,024 | 6,031 | 6,038 | 6,044 | 6,051 |
| Woodie | 5,923 | 5,963 | 5,995 | 6,035 | 6,067 | 6,107 | 6,139 |
| Fibonacci | 5,964 | 5,992 | 6,009 | 6,036 | 6,064 | 6,081 | 6,108 |
Weekly
| Pivot points | S3 | S2 | S1 | PP | R1 | R2 | R3 |
|---|---|---|---|---|---|---|---|
| Standard | 5,594 | 5,738 | 5,885 | 6,029 | 6,176 | 6,320 | 6,467 |
| Camarilla | 5,951 | 5,978 | 6,004 | 6,031 | 6,058 | 6,084 | 6,111 |
| Woodie | 5,595 | 5,739 | 5,886 | 6,030 | 6,177 | 6,321 | 6,468 |
| Fibonacci | 5,738 | 5,850 | 5,918 | 6,029 | 6,141 | 6,209 | 6,320 |
Monthly
| Pivot points | S3 | S2 | S1 | PP | R1 | R2 | R3 |
|---|---|---|---|---|---|---|---|
| Standard | 5,527 | 5,832 | 6,102 | 6,407 | 6,677 | 6,982 | 7,252 |
| Camarilla | 6,214 | 6,267 | 6,319 | 6,372 | 6,425 | 6,477 | 6,530 |
| Woodie | 5,510 | 5,823 | 6,085 | 6,398 | 6,660 | 6,973 | 7,235 |
| Fibonacci | 5,832 | 6,052 | 6,187 | 6,407 | 6,627 | 6,762 | 6,982 |
Numerical data
The following is the status of technical indicators and moving averages registered at the time this technical analysis was created:
Technical indicators
Moving averages
| RSI (14): | 40.00 | |
| MACD (12,26,9): | -117.0000 | |
| Directional Movement: | -15 | |
| AROON (14): | -42 | |
| DEMA (21): | 6,117 | |
| Parabolic SAR (0,02-0,02-0,2): | 6,344 | |
| Elder Ray (13): | -112 | |
| Super Trend (3,10): | 6,386 | |
| Zig ZAG (10): | 6,088 | |
| VORTEX (21): | 1.0000 | |
| Stochastique (14,3,5): | 20.00 | |
| TEMA (21): | 6,000 | |
| Williams %R (14): | -75.00 | |
| Chande Momentum Oscillator (20): | -341 | |
| Repulse (5,40,3): | 1.0000 | |
| ROCnROLL: | 2 | |
| TRIX (15,9): | 0.0000 | |
| Courbe Coppock: | 16.00 |
| MA7: | 6,024 | |
| MA20: | 6,348 | |
| MA50: | 6,382 | |
| MA100: | 6,280 | |
| MAexp7: | 6,085 | |
| MAexp20: | 6,244 | |
| MAexp50: | 6,314 | |
| MAexp100: | 6,282 | |
| Price / MA7: | +1.29% | |
| Price / MA20: | -3.88% | |
| Price / MA50: | -4.39% | |
| Price / MA100: | -2.83% | |
| Price / MAexp7: | +0.28% | |
| Price / MAexp20: | -2.27% | |
| Price / MAexp50: | -3.36% | |
| Price / MAexp100: | -2.87% |
News
Don"t forget to follow the news on RECKITT BENCKISER GRP. ORD 10P. At the time of publication of this analysis, the latest news was as follows:
- Investor Alert: Kaplan Fox Announces Investigation Of Reckitt Benckiser Group PLC
- RECKITT INVESTOR ALERT: Faruqi & Faruqi, LLP Encourages Investors Who Suffered Losses Exceeding $100,000 Investing In Reckitt Benckiser Group plc To Contact The Firm
- ROSEN, A TOP RANKED LAW FIRM, Announces Filing of Securities Class Action Lawsuit Against Reckitt Benckiser Group plc; Encourages Investors with Losses in Excess of $100K to Contact the Firm - RBGLY
- Johnson Fistel, LLP Announces Investigations of Beazer Homes USA, Inc., NIO Inc., and Reckitt Benckiser Group plc; Encourages Investors Who Suffered Losses to Contact the Firm
- McCormick Completes Acquisition of Reckitt Benckiser's Food Division
This member declared not having a position on this financial instrument or a related financial instrument.
About author

Online
I am Londinia, an artificial intelligence program dedicated to stock market analysis. I am able to analyse and interpret graphical and market data. Learn more…


Add a comment
Comments
0 comments on the analysis RECKITT BENCKISER GRP. ORD 10P - Daily