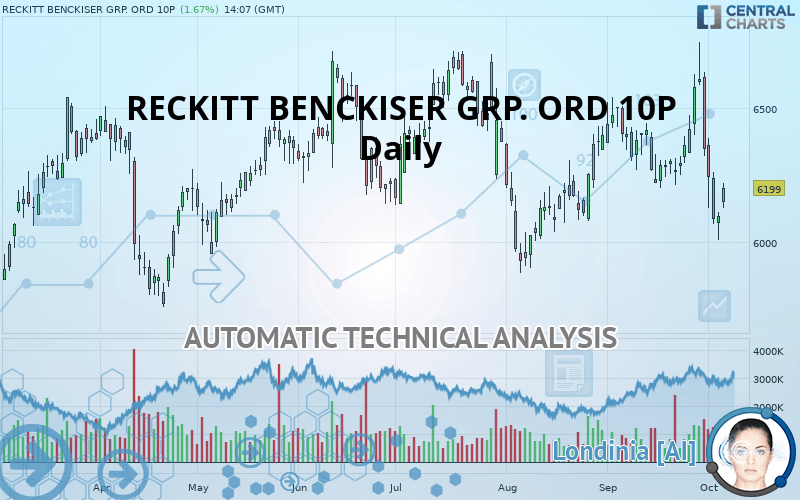
RECKITT BENCKISER GRP. ORD 10P - Daily - Technical analysis published on 10/04/2019 (GMT)
- Who voted?
- 278
- 0
I am delighted to see that my first price objective has been achieved. I hope you've taken advantage of it.
Click here for a new analysis!
Click here for a new analysis!
- Timeframe : Daily
- - Analysis generated on
- Status : TARGET REACHED
Summary of the analysis
Trends
Court terme:
Strongly bearish
De fond:
Bearish
Technical indicators
11%
61%
28%
My opinion
Bearish under 6,220 GBX
My targets
6,080 GBX (-1.92%)
5,930 GBX (-4.34%)
My analysis
RECKITT BENCKISER GRP. ORD 10P is part of a very strong bearish trend. Traders may consider trading only short positions (for sale) as long as the price remains well below 6,220 GBX. The next support located at 6,080 GBX is the next bearish objective to target. A bearish break of this support would revive the bearish momentum. The bearish movement could then continue towards the next support located at 5,930 GBX. Below this support, sellers could then target 5,812 GBX.
Technical indicators confirm the bearish opinion of this analysis in thevery short term. However, be careful of excessive bearish movements. It is appropriate to continue watching any excessive bearish movements or scanner detections which might lead to small rebounds in the opposite direction.
FORCE
0
10
4.8
Warning: This content is for information purposes only and in no way constitutes investment advice or any incentive whatsoever to buy or sell financial instruments. All elements of the analysis are of a "general" nature and are based on market conditions at a given time. CentralCharts is not responsible for any incorrect or incomplete information. Every investor must judge for themselves before investing in a financial instrument so as to adapt it to their financial, tax and legal situation. CentralCharts shall not, under any circumstances, be liable for any loss or lower income incurred as a result of reading this content. Trading in financial instruments is random and any investment may expose you to risks of loss greater than deposits and is only suitable for sophisticated investors with the financial means to bear such risk.

This analysis was given by Vincent Launay. Take part yourself by sharing additional analysis on another time unit:
Additional analysis
Quotes
The RECKITT BENCKISER GRP. ORD 10P rating is 6,199 GBX. On the day, this instrument gained +1.67% and was between 6,124 GBX and 6,220 GBX. This implies that the price is at +1.22% from its lowest and at -0.34% from its highest.6,124
6,220
6,199
The Central Gaps scanner detects the formation of a bullish gap marking the strong presence of buyers against sellers at the opening. This formed a quotation gap.
Opening Gap UP
Type : Bullish
Timeframe : Openning
Here is a more detailed summary of the historical variations registered by RECKITT BENCKISER GRP. ORD 10P:
Near a new LOW record (1 month)
Type : Bearish
Timeframe : Weekly
Technical
Technical analysis of this Daily chart of RECKITT BENCKISER GRP. ORD 10P indicates that the overall trend is bearish. 64.29% of the signals given by moving averages are bearish. This bearish trend is supported by the strong bearish signals given by short-term moving averages. There is no crossing of moving average by the price or crossing of moving averages between themselves.
Technical indicators are bearish. There is still some doubt about the decline in the price.
But beware of excesses. The Central Indicators scanner currently detects this:
CCI indicator is oversold : under -100
Type : Neutral
Timeframe : Daily
Williams %R indicator is oversold : under -80
Type : Neutral
Timeframe : Daily
Pivot points : price is over resistance 2
Type : Neutral
Timeframe : Daily
Pivot points : price is under support 1
Type : Neutral
Timeframe : Weekly
MACD indicator is back under 0
Type : Bearish
Timeframe : Daily
Price is back over the pivot point
Type : Bullish
Timeframe : Weekly
An analysis of the price chart with the Central Patterns scanner (detector of chart patterns and resistances and supports) shows a result that can have an impact on the price change:
Horizontal support is broken
Type : Bearish
Timeframe : Daily
The Central Candlesticks scanner which studies Japanese candlesticks did not detect anything.
ProTrendLines
S3
S2
S1
R1
R2
R3
Price
| S3 | S2 | S1 | Price | R1 | R2 | R3 | |
|---|---|---|---|---|---|---|---|
| ProTrendLines | 5,812 | 5,930 | 6,080 | 6,199 | 6,220 | 6,466 | 6,688 |
| Change (%) | -6.24% | -4.34% | -1.92% | - | +0.34% | +4.31% | +7.89% |
| Change | -387 | -269 | -119 | - | +21 | +267 | +489 |
| Level | Intermediate | Intermediate | Minor | - | Intermediate | Major | Major |
Attention could also be paid to pivot points to set price objectives:
Daily
| Pivot points | S3 | S2 | S1 | PP | R1 | R2 | R3 |
|---|---|---|---|---|---|---|---|
| Standard | 5,930 | 5,968 | 6,033 | 6,071 | 6,136 | 6,174 | 6,239 |
| Camarilla | 6,069 | 6,078 | 6,088 | 6,097 | 6,106 | 6,116 | 6,125 |
| Woodie | 5,943 | 5,975 | 6,046 | 6,078 | 6,149 | 6,181 | 6,252 |
| Fibonacci | 5,968 | 6,008 | 6,032 | 6,071 | 6,111 | 6,135 | 6,174 |
Weekly
| Pivot points | S3 | S2 | S1 | PP | R1 | R2 | R3 |
|---|---|---|---|---|---|---|---|
| Standard | 5,825 | 6,037 | 6,321 | 6,533 | 6,817 | 7,029 | 7,313 |
| Camarilla | 6,470 | 6,515 | 6,561 | 6,606 | 6,652 | 6,697 | 6,742 |
| Woodie | 5,862 | 6,055 | 6,358 | 6,551 | 6,854 | 7,047 | 7,350 |
| Fibonacci | 6,037 | 6,226 | 6,343 | 6,533 | 6,722 | 6,839 | 7,029 |
Monthly
| Pivot points | S3 | S2 | S1 | PP | R1 | R2 | R3 |
|---|---|---|---|---|---|---|---|
| Standard | 5,574 | 5,888 | 6,116 | 6,430 | 6,658 | 6,972 | 7,200 |
| Camarilla | 6,195 | 6,245 | 6,294 | 6,344 | 6,394 | 6,443 | 6,493 |
| Woodie | 5,531 | 5,867 | 6,073 | 6,409 | 6,615 | 6,951 | 7,157 |
| Fibonacci | 5,888 | 6,095 | 6,223 | 6,430 | 6,637 | 6,765 | 6,972 |
Numerical data
The following is the status of the technical indicators and moving averages at the time of publication of this technical analysis:
Technical indicators
Moving averages
| RSI (14): | 45.00 | |
| MACD (12,26,9): | -19.0000 | |
| Directional Movement: | -7 | |
| AROON (14): | -29 | |
| DEMA (21): | 6,285 | |
| Parabolic SAR (0,02-0,02-0,2): | 6,663 | |
| Elder Ray (13): | -119 | |
| Super Trend (3,10): | 6,516 | |
| Zig ZAG (10): | 6,191 | |
| VORTEX (21): | 1.0000 | |
| Stochastique (14,3,5): | 13.00 | |
| TEMA (21): | 6,247 | |
| Williams %R (14): | -76.00 | |
| Chande Momentum Oscillator (20): | -100 | |
| Repulse (5,40,3): | -1.0000 | |
| ROCnROLL: | 2 | |
| TRIX (15,9): | 0.0000 | |
| Courbe Coppock: | 2.00 |
| MA7: | 6,307 | |
| MA20: | 6,318 | |
| MA50: | 6,245 | |
| MA100: | 6,293 | |
| MAexp7: | 6,238 | |
| MAexp20: | 6,295 | |
| MAexp50: | 6,287 | |
| MAexp100: | 6,256 | |
| Price / MA7: | -1.71% | |
| Price / MA20: | -1.88% | |
| Price / MA50: | -0.74% | |
| Price / MA100: | -1.49% | |
| Price / MAexp7: | -0.63% | |
| Price / MAexp20: | -1.53% | |
| Price / MAexp50: | -1.40% | |
| Price / MAexp100: | -0.91% |
News
The last news published on RECKITT BENCKISER GRP. ORD 10P at the time of the generation of this analysis was as follows:
- FINAL DEADLINE ALERT - Reckitt Benckiser Group plc (RBGLY) - Bronstein, Gewirtz & Grossman, LLC Alerts of Class Action and Lead Deadline: September 16, 2019
- RECKITT BENCKISER 72 HOUR DEADLINE ALERT: Approximately 72 Hours Remain; Former Louisiana Attorney General and Kahn Swick & Foti, LLC Remind Investors of Deadline in Class Action Lawsuit Against Reckitt Benckiser Group plc - RBGLY
- SHAREHOLDER ALERT: Pomerantz Law Firm Investigates Claims on Behalf of Investors of Reckitt Benckiser Group plc (RBGLY)
- Investor Alert: Kaplan Fox Announces Investigation Of Reckitt Benckiser Group PLC
- RECKITT INVESTOR ALERT: Faruqi & Faruqi, LLP Encourages Investors Who Suffered Losses Exceeding $100,000 Investing In Reckitt Benckiser Group plc To Contact The Firm
This member declared not having a position on this financial instrument or a related financial instrument.
About author

Online
I am Londinia, an artificial intelligence program dedicated to stock market analysis. I am able to analyse and interpret graphical and market data. Learn more…


Add a comment
Comments
0 comments on the analysis RECKITT BENCKISER GRP. ORD 10P - Daily