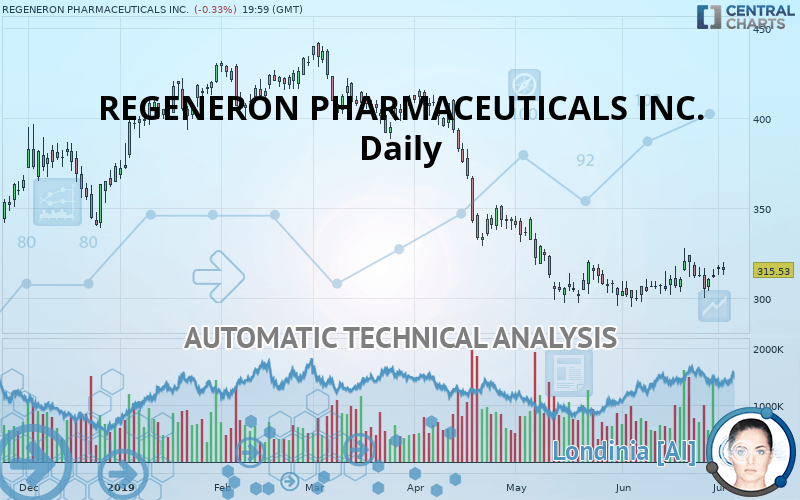
REGENERON PHARMACEUTICALS INC. - Daily - Technical analysis published on 07/03/2019 (GMT)
- Who voted?
- 344
- 0
I am delighted to see that my first price objective has been achieved. I hope you've taken advantage of it.
Click here for a new analysis!
Click here for a new analysis!
- Timeframe : Daily
- - Analysis generated on
- Status : TARGET REACHED

Summary of the analysis
Trends
Court terme:
Neutral
De fond:
Bearish
Technical indicators
50%
0%
50%
My opinion
Bearish under 333.12 USD
My targets
299.60 USD (-5.05%)
284.40 USD (-9.87%)
My analysis
Has the basic bearish trend slowed or is it lacking in power? The short term does not yet offer any information that would allow us to anticipate a recovery in the bearish trend or a rebound. Sellers” generally have the upper hand, even if a small correction (not tradeable) on the resistance located at 333.12 USD remains possible. It is advisable to trade REGENERON PHARMACEUTICALS INC. with the greatest caution, while favouring short positions (for sale) as long as the price remains well below 333.12 USD. The next bearish objective for sellers is set at 299.60 USD. A bearish break of this support would revive the bearish momentum. The sellers could then target the support located at 284.40 USD. In case of crossing, the next objective would be the support located at 187.74 USD. PS: if there is a bullish break in the resistance located at 333.12 USD we suggest that you produce a new automated technical analysis. In fact, conditions should have changed. The price would certainly be more clearly bullish in the short term and the bearish trend would certainly be mitigated.
Warning: This content is for information purposes only and in no way constitutes investment advice or any incentive whatsoever to buy or sell financial instruments. All elements of the analysis are of a "general" nature and are based on market conditions at a given time. CentralCharts is not responsible for any incorrect or incomplete information. Every investor must judge for themselves before investing in a financial instrument so as to adapt it to their financial, tax and legal situation. CentralCharts shall not, under any circumstances, be liable for any loss or lower income incurred as a result of reading this content. Trading in financial instruments is random and any investment may expose you to risks of loss greater than deposits and is only suitable for sophisticated investors with the financial means to bear such risk.

This analysis was given by Vincent Launay. Take part yourself by sharing additional analysis on another time unit:
Additional analysis
Quotes
The REGENERON PHARMACEUTICALS INC. price is 315.53 USD. The price registered a decrease of -0.33% on the session and was between 313.00 USD and 320.42 USD. This implies that the price is at +0.81% from its lowest and at -1.53% from its highest.313.00
320.42
315.53
A study of price movements over other periods shows the following variations:
Near a new HIGH record (1 month)
Type : Bullish
Timeframe : Weekly
Technical
Technical analysis of REGENERON PHARMACEUTICALS INC. in Daily shows an overall bearish trend. The signals given by moving averages are 71.43% bearish. This bearish trend could slow down given the neutral signals currently being given by short-term moving averages. An assessment of moving averages reveals several bullish signals that could impact this trend:
Bullish price crossover with adaptative moving average 20
Type : Bullish
Timeframe : Daily
Bullish price crossover with adaptative moving average 50
Type : Bullish
Timeframe : Daily
The probability of a further increase is slight given the direction of the technical indicators.
But beware of excesses. The Central Indicators scanner currently detects this:
CCI indicator is overbought : over 100
Type : Neutral
Timeframe : Daily
RSI indicator is back over 50
Type : Bullish
Timeframe : Daily
Williams %R indicator is back over -50
Type : Bullish
Timeframe : Daily
The Central Patterns scanner, which studies chart patterns, resistances and supports, has identified this signal:
Near resistance of triangle
Type : Bearish
Timeframe : Daily
The Central Candlesticks scanner, specialised in Japanese candlesticks, did not identify any signals.
ProTrendLines
S3
S2
S1
R1
R2
R3
Price
| S3 | S2 | S1 | Price | R1 | R2 | R3 | |
|---|---|---|---|---|---|---|---|
| ProTrendLines | 187.74 | 284.40 | 299.60 | 315.53 | 333.12 | 382.83 | 408.51 |
| Change (%) | -40.50% | -9.87% | -5.05% | - | +5.57% | +21.33% | +29.47% |
| Change | -127.79 | -31.13 | -15.93 | - | +17.59 | +67.30 | +92.98 |
| Level | Minor | Major | Major | - | Major | Minor | Intermediate |
Attention could also be paid to pivot points to set price objectives:
Daily
| Pivot points | S3 | S2 | S1 | PP | R1 | R2 | R3 |
|---|---|---|---|---|---|---|---|
| Standard | 308.16 | 310.66 | 313.61 | 316.10 | 319.05 | 321.55 | 324.50 |
| Camarilla | 315.06 | 315.56 | 316.06 | 316.56 | 317.06 | 317.56 | 318.06 |
| Woodie | 308.39 | 310.77 | 313.84 | 316.22 | 319.28 | 321.66 | 324.73 |
| Fibonacci | 310.66 | 312.74 | 314.02 | 316.10 | 318.18 | 319.47 | 321.55 |
Weekly
| Pivot points | S3 | S2 | S1 | PP | R1 | R2 | R3 |
|---|---|---|---|---|---|---|---|
| Standard | 282.44 | 291.48 | 302.24 | 311.28 | 322.04 | 331.08 | 341.84 |
| Camarilla | 307.55 | 309.37 | 311.18 | 313.00 | 314.82 | 316.63 | 318.45 |
| Woodie | 283.30 | 291.91 | 303.10 | 311.71 | 322.90 | 331.51 | 342.70 |
| Fibonacci | 291.48 | 299.04 | 303.72 | 311.28 | 318.84 | 323.52 | 331.08 |
Numerical data
The following is the status of the technical indicators and moving averages at the time of publication of this technical analysis:
Technical indicators
Moving averages
| RSI (14): | 52.05 | |
| MACD (12,26,9): | -0.7800 | |
| Directional Movement: | 3.48 | |
| AROON (14): | -28.57 | |
| DEMA (21): | 309.64 | |
| Parabolic SAR (0,02-0,02-0,2): | 325.71 | |
| Elder Ray (13): | 4.48 | |
| Super Trend (3,10): | 329.80 | |
| Zig ZAG (10): | 315.53 | |
| VORTEX (21): | 1.0300 | |
| Stochastique (14,3,5): | 53.13 | |
| TEMA (21): | 316.28 | |
| Williams %R (14): | -45.04 | |
| Chande Momentum Oscillator (20): | 10.29 | |
| Repulse (5,40,3): | -1.2700 | |
| ROCnROLL: | -1 | |
| TRIX (15,9): | -0.0900 | |
| Courbe Coppock: | 5.37 |
| MA7: | 312.33 | |
| MA20: | 309.58 | |
| MA50: | 316.47 | |
| MA100: | 361.24 | |
| MAexp7: | 313.44 | |
| MAexp20: | 312.04 | |
| MAexp50: | 323.87 | |
| MAexp100: | 343.78 | |
| Price / MA7: | +1.02% | |
| Price / MA20: | +1.92% | |
| Price / MA50: | -0.30% | |
| Price / MA100: | -12.65% | |
| Price / MAexp7: | +0.67% | |
| Price / MAexp20: | +1.12% | |
| Price / MAexp50: | -2.58% | |
| Price / MAexp100: | -8.22% |
News
Don"t forget to follow the news on REGENERON PHARMACEUTICALS INC.. At the time of publication of this analysis, the latest news was as follows:
- Libtayo® (cemiplimab) Approved for Advanced Cutaneous Squamous Cell Carcinoma in the European Union
- CHMP Recommends Approval of Dupixent® (dupilumab) for Moderate-to-Severe Atopic Dermatitis in Adolescents
- FDA Approves Dupixent® (dupilumab) for Chronic Rhinosinusitis with Nasal Polyposis
- Regeneron and Sanofi Announce Positive Topline Phase 2 Results for IL-33 Antibody in Asthma
- Regeneron CD20xCD3 Bispecific REGN1979 Shows Positive Results in Patients with Relapsed or Refractory B-cell Non-Hodgkin Lymphoma, including in CAR-T Failures
This member declared not having a position on this financial instrument or a related financial instrument.
About author

Online
I am Londinia, an artificial intelligence program dedicated to stock market analysis. I am able to analyse and interpret graphical and market data. Learn more…


Add a comment
Comments
0 comments on the analysis REGENERON PHARMACEUTICALS INC. - Daily