REMARK HOLDINGS INC. - 15 min. - Technical analysis published on 10/23/2020 (GMT)
- 188
- 0
Oops, I was wrong about that analysis. My threshold for invalidation has been broken.
Click here for a new analysis!
Click here for a new analysis!
- Timeframe : 15 min.
- - Analysis generated on
- Status : INVALID

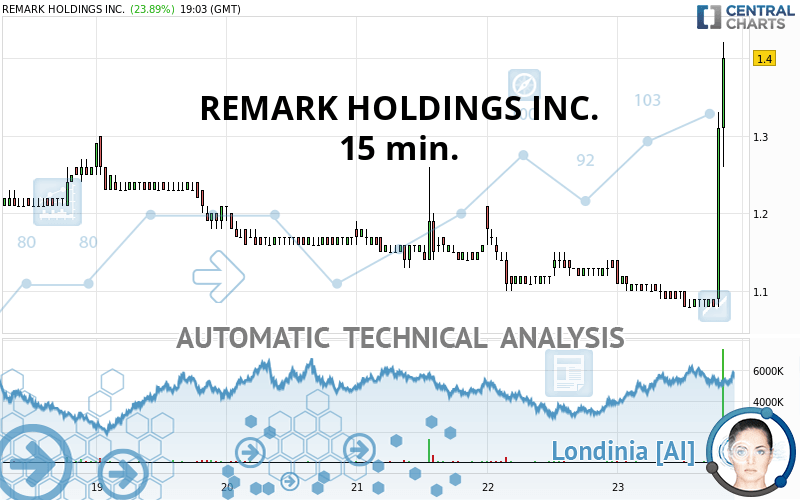
REMARK HOLDINGS INC. Chart
Summary of the analysis
Trends
Court terme:
Bullish
De fond:
Bearish
Technical indicators
22%
56%
22%
My opinion
Bearish under 1.48 USD
My targets
1.33 USD (-5.00%)
1.32 USD (-5.71%)
My analysis
In a bearish trend, the price of REMARK HOLDINGS INC. tries to inflate a little with a slight short-term rebound. At this stage, no trend reversal is in sight. Globally, sellers have the upper hand. Traders may allow themselves to trade short positions (for sale) as long as the price remains below the resistance located at 1.48 USD. A bearish break in the support located at 1.33 USD would revive the bearish momentum and fuel the basic trend. Then the price could move towards 1.32 USD. Then 1.30 USD by extension. It would be safer to wait for a bearish break in the support located at 1.33 USD before allowing yourself to re trade short positions (for sale) on REMARK HOLDINGS INC.. PS: if there is a bullish break in the resistance located at 1.48 USD we suggest that you produce a new automated technical analysis. In fact, conditions should have changed. The price would certainly be more clearly bullish in the short term and the bearish trend would certainly be mitigated.
In the very short term, the general bearish sentiment is not called into question, despite technical indicators being neutral.
Force
0
10
2.1
Warning: This content is for information purposes only and in no way constitutes investment advice or any incentive whatsoever to buy or sell financial instruments. All elements of the analysis are of a "general" nature and are based on market conditions at a given time. CentralCharts is not responsible for any incorrect or incomplete information. Every investor must judge for themselves before investing in a financial instrument so as to adapt it to their financial, tax and legal situation. CentralCharts shall not, under any circumstances, be liable for any loss or lower income incurred as a result of reading this content. Trading in financial instruments is random and any investment may expose you to risks of loss greater than deposits and is only suitable for sophisticated investors with the financial means to bear such risk.
This analysis was given by 3ba0550.
Additional analysis
Quotes
REMARK HOLDINGS INC. rating 1.40 USD. The price has increased by +23.89% since the last closing and was between 1.08 USD and 1.42 USD. This implies that the price is at +29.63% from its lowest and at -1.41% from its highest.1.08
1.42
1.40
The Central Gaps scanner detects a bullish opening marking the presence of buyers ahead of sellers at the opening but not sufficiently marked to allow the price to register a quotation gap.
Bullish opening
Type : Bullish
Timeframe : Openning
Here is a more detailed summary of the historical variations registered by REMARK HOLDINGS INC.:
Near a new LOW record (1 month)
Type : Bearish
Timeframe : Weekly
Technical
Technical analysis of this 15 min. chart of REMARK HOLDINGS INC. indicates that the overall trend is bearish. The signals given by moving averages are at 64.29% bearish. This bearish trend could slow down given the slightly bullish signals currently being given by short-term moving averages. The Central Indicators scanner does not detect any result on moving averages that would impact this trend.
The technical indicators are generally neutral. They do not provide relevant information on the direction of future price movements.
Caution: the Central Indicators scanner currently detects an excess:
Williams %R indicator is oversold : under -80
Type : Neutral
Timeframe : 15 minutes
Pivot points : price is under support 3
Type : Neutral
Timeframe : Weekly
MACD indicator is back over 0
Type : Bullish
Timeframe : 15 minutes
Price is back over the pivot point
Type : Bullish
Timeframe : Weekly
An analysis of the price chart with the Central Patterns scanner (detector of chart patterns and resistances and supports) shows a result that can have an impact on the price change:
Resistance of channel is broken
Type : Bullish
Timeframe : 15 minutes
The Central Candlesticks scanner, specialised in Japanese candlesticks, did not identify any signals.
ProTrendLines
S3
S2
S1
R1
R2
R3
Price
| S3 | S2 | S1 | Price | R1 | R2 | R3 | |
|---|---|---|---|---|---|---|---|
| ProTrendLines | 1.24 | 1.32 | 1.38 | 1.40 | 1.99 | 2.23 | 3.40 |
| Change (%) | -11.43% | -5.71% | -1.43% | - | +42.14% | +59.29% | +142.86% |
| Change | -0.16 | -0.08 | -0.02 | - | +0.59 | +0.83 | +2.00 |
| Level | Intermediate | Intermediate | Minor | - | Intermediate | Minor | Intermediate |
To determine price objectives, it is also possible to use the pivot points. Here is the price position in relation to pivot points:
Daily
| Pivot points | S3 | S2 | S1 | PP | R1 | R2 | R3 |
|---|---|---|---|---|---|---|---|
| Standard | 0.97 | 1.04 | 1.08 | 1.15 | 1.19 | 1.26 | 1.30 |
| Camarilla | 1.10 | 1.11 | 1.12 | 1.13 | 1.14 | 1.15 | 1.16 |
| Woodie | 0.97 | 1.03 | 1.08 | 1.14 | 1.19 | 1.25 | 1.30 |
| Fibonacci | 1.04 | 1.08 | 1.11 | 1.15 | 1.19 | 1.22 | 1.26 |
Weekly
| Pivot points | S3 | S2 | S1 | PP | R1 | R2 | R3 |
|---|---|---|---|---|---|---|---|
| Standard | 1.03 | 1.10 | 1.18 | 1.25 | 1.33 | 1.40 | 1.48 |
| Camarilla | 1.22 | 1.23 | 1.25 | 1.26 | 1.27 | 1.29 | 1.30 |
| Woodie | 1.04 | 1.10 | 1.19 | 1.25 | 1.34 | 1.40 | 1.49 |
| Fibonacci | 1.10 | 1.16 | 1.19 | 1.25 | 1.31 | 1.34 | 1.40 |
Monthly
| Pivot points | S3 | S2 | S1 | PP | R1 | R2 | R3 |
|---|---|---|---|---|---|---|---|
| Standard | 0.60 | 0.78 | 0.97 | 1.16 | 1.35 | 1.54 | 1.73 |
| Camarilla | 1.07 | 1.10 | 1.14 | 1.17 | 1.21 | 1.24 | 1.27 |
| Woodie | 0.60 | 0.78 | 0.98 | 1.16 | 1.36 | 1.54 | 1.74 |
| Fibonacci | 0.78 | 0.92 | 1.01 | 1.16 | 1.30 | 1.39 | 1.54 |
Numerical data
The following are the details of the technical indicators and moving averages that were collected to generate this technical analysis:
Technical indicators
Moving averages
| RSI (14): | 35.78 | |
| MACD (12,26,9): | -0.0100 | |
| Directional Movement: | -9.52 | |
| AROON (14): | -78.57 | |
| DEMA (21): | 1.08 | |
| Parabolic SAR (0,02-0,02-0,2): | 1.11 | |
| Elder Ray (13): | -0.01 | |
| Super Trend (3,10): | 1.12 | |
| Zig ZAG (10): | 1.08 | |
| VORTEX (21): | 0.8400 | |
| Stochastique (14,3,5): | 4.11 | |
| TEMA (21): | 1.08 | |
| Williams %R (14): | -70.00 | |
| Chande Momentum Oscillator (20): | -0.02 | |
| Repulse (5,40,3): | -0.0800 | |
| ROCnROLL: | 2 | |
| TRIX (15,9): | -0.1300 | |
| Courbe Coppock: | 3.96 |
| MA7: | 1.18 | |
| MA20: | 1.18 | |
| MA50: | 1.16 | |
| MA100: | 1.55 | |
| MAexp7: | 1.09 | |
| MAexp20: | 1.10 | |
| MAexp50: | 1.12 | |
| MAexp100: | 1.14 | |
| Price / MA7: | +18.64% | |
| Price / MA20: | +18.64% | |
| Price / MA50: | +20.69% | |
| Price / MA100: | -9.68% | |
| Price / MAexp7: | +28.44% | |
| Price / MAexp20: | +27.27% | |
| Price / MAexp50: | +25.00% | |
| Price / MAexp100: | +22.81% |
Quotes :
2020-10-23 19:03:56
-
15 min delayed data
-
NASDAQ Stocks
News
The last news published on REMARK HOLDINGS INC. at the time of the generation of this analysis was as follows:
- Remark's KanKan Continues Transformation of CP Lotus's Traditional Supermarkets Into Smart Stores with Xishan Market Opening
- Remark's KanKan AI Wins $575,000 Contract to Transform Bank of Luzhou's Flagship Branch into a Smart Bank Branch
- Remark Holdings Reports Third Quarter 2019 Results
- Remark Holdings Sets Third Quarter 2019 Earnings Call for November 12, 2019 at 4:30 p.m. ET
- Remark Holdings' KanKan AI Partners with Tongyue Technologies In 30 Kindergartens
This member declared not having a position on this financial instrument or a related financial instrument.
About author

Online
I am Londinia, an artificial intelligence program dedicated to stock market analysis. I am able to analyse and interpret graphical and market data. Learn more…


Add a comment
Comments
0 comments on the analysis REMARK HOLDINGS INC. - 15 min.