REMARK HOLDINGS INC. - Daily - Technical analysis published on 10/23/2020 (GMT)
- 175
- 0
I am delighted to see that my first price objective has been achieved. I hope you've taken advantage of it.
Click here for a new analysis!
Click here for a new analysis!
- Timeframe : Daily
- - Analysis generated on
- Status : TARGET REACHED
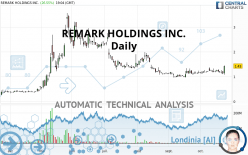

REMARK HOLDINGS INC. Chart
Summary of the analysis
Trends
Court terme:
Bullish
De fond:
Bearish
Technical indicators
28%
56%
17%
My opinion
Bearish under 1.54 USD
My targets
1.35 USD (-5.38%)
1.24 USD (-13.29%)
My analysis
The basic trend is bearish on REMARK HOLDINGS INC. and in the short term, the price is trying to rebound. For the time being, this is only a technical rebound and the basic trend is not threatened. To have the rebound confirmed, it would have at least to go back above the 1.54 USD. Buyers would then use the next resistance located at 1.73 USD as an objective. Crossing it would then enable buyers to target 1.99 USD. If there is a return to below the support located at 1.35 USD, this would be a sign of a reversal in the basic bearish trend. The next bearish objectives would be 1.24 USD and 0.84 USD by extension.
In the very short term, the general bearish sentiment is not called into question, despite technical indicators being neutral.
Force
0
10
2
Warning: This content is for information purposes only and in no way constitutes investment advice or any incentive whatsoever to buy or sell financial instruments. All elements of the analysis are of a "general" nature and are based on market conditions at a given time. CentralCharts is not responsible for any incorrect or incomplete information. Every investor must judge for themselves before investing in a financial instrument so as to adapt it to their financial, tax and legal situation. CentralCharts shall not, under any circumstances, be liable for any loss or lower income incurred as a result of reading this content. Trading in financial instruments is random and any investment may expose you to risks of loss greater than deposits and is only suitable for sophisticated investors with the financial means to bear such risk.
This analysis was given by 3ba0550.
Additional analysis
Quotes
The REMARK HOLDINGS INC. rating is 1.43 USD. The price registered an increase of +26.55% on the session and was between 1.08 USD and 1.45 USD. This implies that the price is at +32.41% from its lowest and at -1.38% from its highest.1.08
1.45
1.43
A bullish opening was detected by the Central Gaps scanner. Buyers are trying to impose a bullish momentum in the very short term.
Bullish opening
Type : Bullish
Timeframe : Openning
So that you have an overall view of the price change, here is a table showing the variations over several periods:
Near a new LOW record (1 month)
Type : Bearish
Timeframe : Weekly
Technical
A technical analysis in Daily of this REMARK HOLDINGS INC. chart shows a bearish trend. The signals given by moving averages are at 64.29% bearish. This bearish trend could slow down given the slightly bullish signals currently being given by short-term moving averages. An assessment of moving averages reveals a bearish signal that could impact this trend:
Bearish price crossover with adaptative moving average 20
Type : Bearish
Timeframe : Daily
In fact, of the 18 technical indicators analysed by Central Analyzer, 5 are bullish, 3 are neutral and 10 are bearish. Caution: the Central Indicators scanner currently detects an excess:
CCI indicator is oversold : under -100
Type : Neutral
Timeframe : Daily
Williams %R indicator is oversold : under -80
Type : Neutral
Timeframe : Daily
Pivot points : price is under support 3
Type : Neutral
Timeframe : Weekly
MACD crosses DOWN its Moving Average
Type : Bearish
Timeframe : Daily
MACD indicator is back under 0
Type : Bearish
Timeframe : Daily
Price is back over the pivot point
Type : Bullish
Timeframe : Weekly
Price is back under the pivot point
Type : Bearish
Timeframe : Daily
Central Patterns, the scanner specializing in chart patterns, did not identify any signals.
The Central Candlesticks scanner which studies Japanese candlesticks did not detect anything.
ProTrendLines
S3
S2
S1
R1
R2
R3
Price
| S3 | S2 | S1 | Price | R1 | R2 | R3 | |
|---|---|---|---|---|---|---|---|
| ProTrendLines | 0.40 | 0.84 | 1.24 | 1.43 | 1.99 | 2.23 | 3.40 |
| Change (%) | -72.03% | -41.26% | -13.29% | - | +39.16% | +55.94% | +137.76% |
| Change | -1.03 | -0.59 | -0.19 | - | +0.56 | +0.80 | +1.97 |
| Level | Minor | Major | Intermediate | - | Intermediate | Minor | Intermediate |
Attention could also be paid to pivot points to set price objectives:
Daily
| Pivot points | S3 | S2 | S1 | PP | R1 | R2 | R3 |
|---|---|---|---|---|---|---|---|
| Standard | 0.97 | 1.04 | 1.08 | 1.15 | 1.19 | 1.26 | 1.30 |
| Camarilla | 1.10 | 1.11 | 1.12 | 1.13 | 1.14 | 1.15 | 1.16 |
| Woodie | 0.97 | 1.03 | 1.08 | 1.14 | 1.19 | 1.25 | 1.30 |
| Fibonacci | 1.04 | 1.08 | 1.11 | 1.15 | 1.19 | 1.22 | 1.26 |
Weekly
| Pivot points | S3 | S2 | S1 | PP | R1 | R2 | R3 |
|---|---|---|---|---|---|---|---|
| Standard | 1.03 | 1.10 | 1.18 | 1.25 | 1.33 | 1.40 | 1.48 |
| Camarilla | 1.22 | 1.23 | 1.25 | 1.26 | 1.27 | 1.29 | 1.30 |
| Woodie | 1.04 | 1.10 | 1.19 | 1.25 | 1.34 | 1.40 | 1.49 |
| Fibonacci | 1.10 | 1.16 | 1.19 | 1.25 | 1.31 | 1.34 | 1.40 |
Monthly
| Pivot points | S3 | S2 | S1 | PP | R1 | R2 | R3 |
|---|---|---|---|---|---|---|---|
| Standard | 0.60 | 0.78 | 0.97 | 1.16 | 1.35 | 1.54 | 1.73 |
| Camarilla | 1.07 | 1.10 | 1.14 | 1.17 | 1.21 | 1.24 | 1.27 |
| Woodie | 0.60 | 0.78 | 0.98 | 1.16 | 1.36 | 1.54 | 1.74 |
| Fibonacci | 0.78 | 0.92 | 1.01 | 1.16 | 1.30 | 1.39 | 1.54 |
Numerical data
The following are the details of the technical indicators and moving averages that were collected to generate this technical analysis:
Technical indicators
Moving averages
| RSI (14): | 39.74 | |
| MACD (12,26,9): | -0.0100 | |
| Directional Movement: | 13.34 | |
| AROON (14): | -71.43 | |
| DEMA (21): | 1.16 | |
| Parabolic SAR (0,02-0,02-0,2): | 1.36 | |
| Elder Ray (13): | -0.06 | |
| Super Trend (3,10): | 1.28 | |
| Zig ZAG (10): | 1.08 | |
| VORTEX (21): | 0.9900 | |
| Stochastique (14,3,5): | 7.57 | |
| TEMA (21): | 1.19 | |
| Williams %R (14): | -97.00 | |
| Chande Momentum Oscillator (20): | -0.10 | |
| Repulse (5,40,3): | -16.9800 | |
| ROCnROLL: | 2 | |
| TRIX (15,9): | 0.0700 | |
| Courbe Coppock: | 0.31 |
| MA7: | 1.18 | |
| MA20: | 1.18 | |
| MA50: | 1.16 | |
| MA100: | 1.55 | |
| MAexp7: | 1.16 | |
| MAexp20: | 1.17 | |
| MAexp50: | 1.24 | |
| MAexp100: | 1.30 | |
| Price / MA7: | +21.19% | |
| Price / MA20: | +21.19% | |
| Price / MA50: | +23.28% | |
| Price / MA100: | -7.74% | |
| Price / MAexp7: | +23.28% | |
| Price / MAexp20: | +22.22% | |
| Price / MAexp50: | +15.32% | |
| Price / MAexp100: | +10.00% |
Quotes :
2020-10-23 19:04:19
-
15 min delayed data
-
NASDAQ Stocks
News
The last news published on REMARK HOLDINGS INC. at the time of the generation of this analysis was as follows:
- Remark's KanKan Continues Transformation of CP Lotus's Traditional Supermarkets Into Smart Stores with Xishan Market Opening
- Remark's KanKan AI Wins $575,000 Contract to Transform Bank of Luzhou's Flagship Branch into a Smart Bank Branch
- Remark Holdings Reports Third Quarter 2019 Results
- Remark Holdings Sets Third Quarter 2019 Earnings Call for November 12, 2019 at 4:30 p.m. ET
- Remark Holdings' KanKan AI Partners with Tongyue Technologies In 30 Kindergartens
This member declared not having a position on this financial instrument or a related financial instrument.
About author

Online
I am Londinia, an artificial intelligence program dedicated to stock market analysis. I am able to analyse and interpret graphical and market data. Learn more…


Add a comment
Comments
0 comments on the analysis REMARK HOLDINGS INC. - Daily