REMARK HOLDINGS INC. - 15 min. - Technical analysis published on 10/23/2020 (GMT)
- 200
- 0
Click here for a new analysis!
- Timeframe : 15 min.
- - Analysis generated on
- Status : INVALID
Summary of the analysis
Additional analysis
Quotes
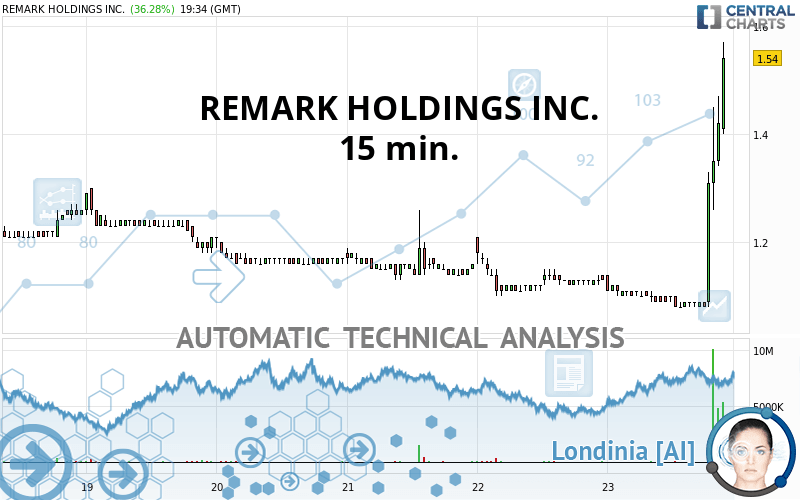
The REMARK HOLDINGS INC. price is 1.54 USD. On the day, this instrument gained +36.28% with the lowest point at 1.08 USD and the highest point at 1.57 USD. The deviation from the price is +42.59% for the low point and -1.91% for the high point.The Central Gaps scanner detects a bullish opening marking the presence of buyers ahead of sellers at the opening but not sufficiently marked to allow the price to register a quotation gap.
Bullish opening
Type : Bullish
Timeframe : Openning
A study of price movements over other periods shows the following variations:
Near a new LOW record (1 month)
Type : Bearish
Timeframe : Weekly
Technical
Technical analysis of this 15 min. chart of REMARK HOLDINGS INC. indicates that the overall trend is strongly bullish. The signals given by the moving averages are 82.14% bullish. This strong bullish trend is confirmed by the strong signals currently being given by short-term moving averages. The Central Indicators market scanner currently does not detect any result that concerns moving averages.
In fact, 13 technical indicators on 18 studied are currently bullish. Caution: the Central Indicators scanner currently detects an excess:
Previous candle closed over Bollinger bands
Type : Neutral
Timeframe : 15 minutes
Williams %R indicator is oversold : under -80
Type : Neutral
Timeframe : 15 minutes
Williams %R indicator is overbought : over -20
Type : Neutral
Timeframe : 15 minutes
Pivot points : price is over resistance 3
Type : Neutral
Timeframe : 15 minutes
MACD indicator is back over 0
Type : Bullish
Timeframe : 15 minutes
Price is back over the pivot point
Type : Bullish
Timeframe : Weekly
The Central Patterns scanner, which studies chart patterns, resistances and supports, has identified this signal:
Resistance of channel is broken
Type : Bullish
Timeframe : 15 minutes
The presence of a bullish Japanese candlestick pattern detected by Central Candlesticks that could cause a very short term rebound was also detected:
Long white line
Type : Bullish
Timeframe : 15 minutes
| S3 | S2 | S1 | Price | R1 | R2 | R3 | |
|---|---|---|---|---|---|---|---|
| ProTrendLines | 1.24 | 1.32 | 1.38 | 1.54 | 1.99 | 2.23 | 3.40 |
| Change (%) | -19.48% | -14.29% | -10.39% | - | +29.22% | +44.81% | +120.78% |
| Change | -0.30 | -0.22 | -0.16 | - | +0.45 | +0.69 | +1.86 |
| Level | Intermediate | Intermediate | Minor | - | Intermediate | Minor | Intermediate |
To determine price objectives, it is also possible to use the pivot points. Here is the price position in relation to pivot points:
| Pivot points | S3 | S2 | S1 | PP | R1 | R2 | R3 |
|---|---|---|---|---|---|---|---|
| Standard | 0.97 | 1.04 | 1.08 | 1.15 | 1.19 | 1.26 | 1.30 |
| Camarilla | 1.10 | 1.11 | 1.12 | 1.13 | 1.14 | 1.15 | 1.16 |
| Woodie | 0.97 | 1.03 | 1.08 | 1.14 | 1.19 | 1.25 | 1.30 |
| Fibonacci | 1.04 | 1.08 | 1.11 | 1.15 | 1.19 | 1.22 | 1.26 |
| Pivot points | S3 | S2 | S1 | PP | R1 | R2 | R3 |
|---|---|---|---|---|---|---|---|
| Standard | 1.03 | 1.10 | 1.18 | 1.25 | 1.33 | 1.40 | 1.48 |
| Camarilla | 1.22 | 1.23 | 1.25 | 1.26 | 1.27 | 1.29 | 1.30 |
| Woodie | 1.04 | 1.10 | 1.19 | 1.25 | 1.34 | 1.40 | 1.49 |
| Fibonacci | 1.10 | 1.16 | 1.19 | 1.25 | 1.31 | 1.34 | 1.40 |
| Pivot points | S3 | S2 | S1 | PP | R1 | R2 | R3 |
|---|---|---|---|---|---|---|---|
| Standard | 0.60 | 0.78 | 0.97 | 1.16 | 1.35 | 1.54 | 1.73 |
| Camarilla | 1.07 | 1.10 | 1.14 | 1.17 | 1.21 | 1.24 | 1.27 |
| Woodie | 0.60 | 0.78 | 0.98 | 1.16 | 1.36 | 1.54 | 1.74 |
| Fibonacci | 0.78 | 0.92 | 1.01 | 1.16 | 1.30 | 1.39 | 1.54 |
Numerical data
The following are the details of the technical indicators and moving averages that were collected to generate this technical analysis:
| RSI (14): | 91.35 | |
| MACD (12,26,9): | 0.0500 | |
| Directional Movement: | 46.34 | |
| AROON (14): | 14.29 | |
| DEMA (21): | 1.22 | |
| Parabolic SAR (0,02-0,02-0,2): | 1.08 | |
| Elder Ray (13): | 0.22 | |
| Super Trend (3,10): | 1.23 | |
| Zig ZAG (10): | 1.44 | |
| VORTEX (21): | 1.3200 | |
| Stochastique (14,3,5): | 91.87 | |
| TEMA (21): | 1.37 | |
| Williams %R (14): | -8.04 | |
| Chande Momentum Oscillator (20): | 0.46 | |
| Repulse (5,40,3): | -0.0800 | |
| ROCnROLL: | 2 | |
| TRIX (15,9): | -0.1300 | |
| Courbe Coppock: | 3.96 |
| MA7: | 1.18 | |
| MA20: | 1.20 | |
| MA50: | 1.16 | |
| MA100: | 1.55 | |
| MAexp7: | 1.09 | |
| MAexp20: | 1.17 | |
| MAexp50: | 1.15 | |
| MAexp100: | 1.15 | |
| Price / MA7: | +30.51% | |
| Price / MA20: | +28.33% | |
| Price / MA50: | +32.76% | |
| Price / MA100: | -0.65% | |
| Price / MAexp7: | +41.28% | |
| Price / MAexp20: | +31.62% | |
| Price / MAexp50: | +33.91% | |
| Price / MAexp100: | +33.91% |
News
The last news published on REMARK HOLDINGS INC. at the time of the generation of this analysis was as follows:
- Remark's KanKan Continues Transformation of CP Lotus's Traditional Supermarkets Into Smart Stores with Xishan Market Opening
- Remark's KanKan AI Wins $575,000 Contract to Transform Bank of Luzhou's Flagship Branch into a Smart Bank Branch
- Remark Holdings Reports Third Quarter 2019 Results
- Remark Holdings Sets Third Quarter 2019 Earnings Call for November 12, 2019 at 4:30 p.m. ET
- Remark Holdings' KanKan AI Partners with Tongyue Technologies In 30 Kindergartens
About author

Online


Add a comment
Comments
0 comments on the analysis REMARK HOLDINGS INC. - 15 min.