RENAULT - Renault Is Developing Within a Symmetrical Triangle (Weekly) - 07/25/2017 (GMT)
- Who voted?
- 573
- 0
- Timeframe : Daily
RENAULT Chart
Are you looking for opportunities in European stocks?
DISCOVER LONDINIA OPPORTUNITIES...
DISCOVER LONDINIA OPPORTUNITIES...
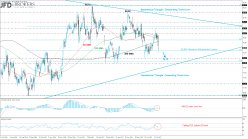
Renault (Euronext Paris: RNO.P) is a French multinational automobile manufacturer established in 1899. The stock price of Renault lost almost 3% during Friday’s trading session and completed the fourth red day in a row. On a weekly timeframe, the price is developing within a symmetrical triangle since October of 2014.
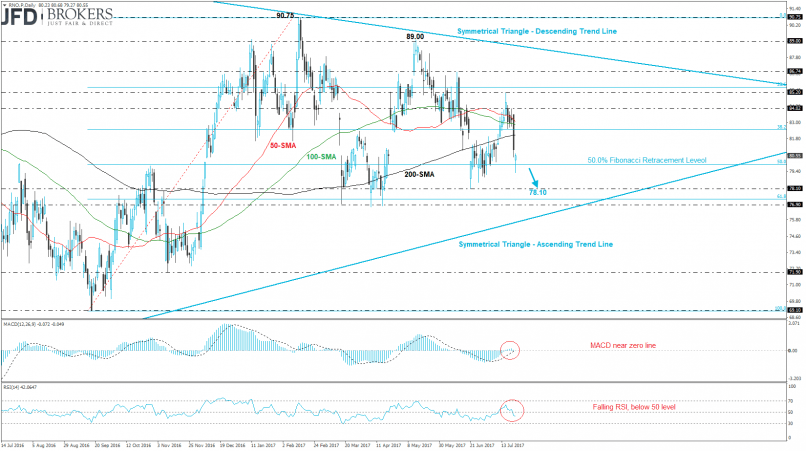
Going to a short-term timeframe, the share price is ready to challenge the next support handle at €78.10 while it is trading beneath the three simple moving averages (50, 100 and 200). Currently, the price hit the 50.0% Fibonacci retracement level, near €79.90 (high at €90.75 and low at €69.10) and rose higher. The MACD oscillator is moving in a positive territory with some weak momentum as it lies near its mid-level. Additionally, the RSI indicator dropped below the 50 level indicating for further bearish momentum on price.
Going to a short-term timeframe, the share price is ready to challenge the next support handle at €78.10 while it is trading beneath the three simple moving averages (50, 100 and 200). Currently, the price hit the 50.0% Fibonacci retracement level, near €79.90 (high at €90.75 and low at €69.10) and rose higher. The MACD oscillator is moving in a positive territory with some weak momentum as it lies near its mid-level. Additionally, the RSI indicator dropped below the 50 level indicating for further bearish momentum on price.
This member did not declare if he had a position on this financial instrument or a related financial instrument.
About author

Offline


Add a comment
Comments
0 comments on the analysis RENAULT - Daily