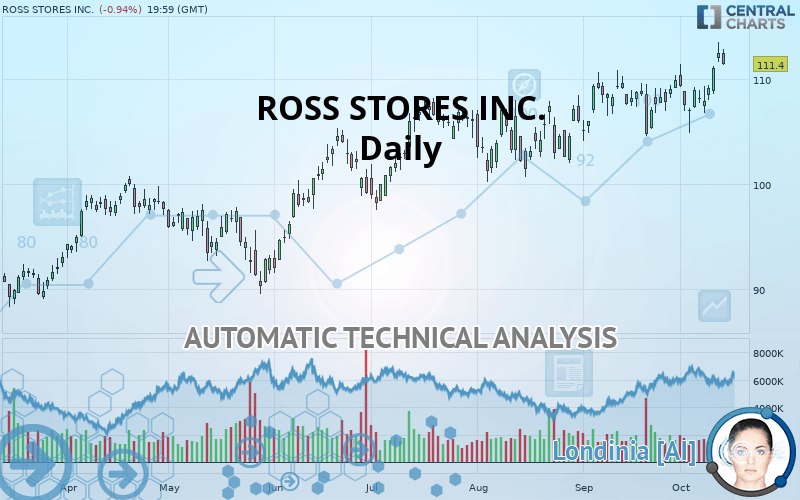
ROSS STORES INC. - Daily - Technical analysis published on 10/14/2019 (GMT)
- Who voted?
- 354
- 0
Click here for a new analysis!
- Timeframe : Daily
- - Analysis generated on
- Status : TARGET REACHED

Summary of the analysis

Additional analysis
Quotes
ROSS STORES INC. rating 111.40 USD. On the day, this instrument lost -0.94% and was between 111.33 USD and 112.84 USD. This implies that the price is at +0.06% from its lowest and at -1.28% from its highest.The Central Gaps scanner detects a bearish opening. A small advantage for sellers in the very short term.
Bearish opening
Type : Bearish
Timeframe : Openning
So that you have an overall view of the price change, here is a table showing the variations over several periods:
Near a new HIGH record (5 years)
Type : Bullish
Timeframe : Weekly
Near a new HIGH record (1 year)
Type : Bullish
Timeframe : Weekly
Near a new HIGH record (1st january)
Type : Bullish
Timeframe : Weekly
Near a new HIGH record (1 month)
Type : Bullish
Timeframe : Weekly
Technical
A technical analysis in Daily of this ROSS STORES INC. chart shows a strongly bullish trend. 92.86% of the signals given by moving averages are bullish. This strongly bullish trend is supported by the strong bullish signals given by short-term moving averages. There is no crossing of moving average by the price or crossing of moving averages between themselves.
In fact, according to the parameters integrated into the Central Analyzer system, 14 technical indicators out of 18 analysed are currently bullish. Caution: the Central Indicators scanner currently detects an excess:
CCI indicator is overbought : over 100
Type : Neutral
Timeframe : Daily
Williams %R indicator is overbought : over -20
Type : Neutral
Timeframe : Daily
Pivot points : price is under support 1
Type : Neutral
Timeframe : Daily
Price is back over the pivot point
Type : Bullish
Timeframe : Weekly
Central Patterns, the market scanner focusing on chart patterns, resistances and supports found this result:
Resistance of channel is broken
Type : Bullish
Timeframe : Daily
For a small rebound in the very short term, the Central Candlesticks scanner currently notes the presence of this bullish pattern in Japanese candlesticks:
Upside gap
Type : Bullish
Timeframe : Daily
| S3 | S2 | S1 | Price | |
|---|---|---|---|---|
| ProTrendLines | 100.00 | 103.33 | 109.36 | 111.40 |
| Change (%) | -10.23% | -7.24% | -1.83% | - |
| Change | -11.40 | -8.07 | -2.04 | - |
| Level | Minor | Major | Major | - |
Attention could also be paid to pivot points to set price objectives:
| Pivot points | S3 | S2 | S1 | PP | R1 | R2 | R3 |
|---|---|---|---|---|---|---|---|
| Standard | 109.72 | 110.69 | 111.57 | 112.54 | 113.43 | 114.40 | 115.28 |
| Camarilla | 111.95 | 112.12 | 112.29 | 112.46 | 112.63 | 112.80 | 112.97 |
| Woodie | 109.68 | 110.67 | 111.53 | 112.52 | 113.39 | 114.38 | 115.24 |
| Fibonacci | 110.69 | 111.40 | 111.83 | 112.54 | 113.25 | 113.69 | 114.40 |
| Pivot points | S3 | S2 | S1 | PP | R1 | R2 | R3 |
|---|---|---|---|---|---|---|---|
| Standard | 101.63 | 104.21 | 108.34 | 110.92 | 115.05 | 117.63 | 121.76 |
| Camarilla | 110.62 | 111.23 | 111.85 | 112.46 | 113.08 | 113.69 | 114.31 |
| Woodie | 102.40 | 104.60 | 109.11 | 111.31 | 115.82 | 118.02 | 122.53 |
| Fibonacci | 104.21 | 106.78 | 108.36 | 110.92 | 113.49 | 115.07 | 117.63 |
| Pivot points | S3 | S2 | S1 | PP | R1 | R2 | R3 |
|---|---|---|---|---|---|---|---|
| Standard | 98.43 | 101.12 | 105.49 | 108.18 | 112.55 | 115.24 | 119.61 |
| Camarilla | 107.91 | 108.56 | 109.20 | 109.85 | 110.50 | 111.14 | 111.79 |
| Woodie | 99.26 | 101.54 | 106.32 | 108.60 | 113.38 | 115.66 | 120.44 |
| Fibonacci | 101.12 | 103.82 | 105.49 | 108.18 | 110.88 | 112.55 | 115.24 |
Numerical data
The following are the details of the technical indicators and moving averages that were collected to generate this technical analysis:
| RSI (14): | 59.65 | |
| MACD (12,26,9): | 1.0900 | |
| Directional Movement: | 8.64 | |
| AROON (14): | 42.86 | |
| DEMA (21): | 110.27 | |
| Parabolic SAR (0,02-0,02-0,2): | 105.29 | |
| Elder Ray (13): | 2.60 | |
| Super Trend (3,10): | 106.06 | |
| Zig ZAG (10): | 111.40 | |
| VORTEX (21): | 1.0100 | |
| Stochastique (14,3,5): | 85.81 | |
| TEMA (21): | 110.57 | |
| Williams %R (14): | -24.28 | |
| Chande Momentum Oscillator (20): | 3.55 | |
| Repulse (5,40,3): | 0.2100 | |
| ROCnROLL: | 1 | |
| TRIX (15,9): | 0.1100 | |
| Courbe Coppock: | 4.22 |
| MA7: | 109.86 | |
| MA20: | 108.63 | |
| MA50: | 106.67 | |
| MA100: | 103.72 | |
| MAexp7: | 110.28 | |
| MAexp20: | 108.92 | |
| MAexp50: | 107.02 | |
| MAexp100: | 104.20 | |
| Price / MA7: | +1.40% | |
| Price / MA20: | +2.55% | |
| Price / MA50: | +4.43% | |
| Price / MA100: | +7.40% | |
| Price / MAexp7: | +1.02% | |
| Price / MAexp20: | +2.28% | |
| Price / MAexp50: | +4.09% | |
| Price / MAexp100: | +6.91% |
News
The latest news and videos published on ROSS STORES INC. at the time of the analysis were as follows:
- Ross Stores Opens 42 New Locations
- Ross Dress for Less to Open a New Store in Minot, North Dakota
- Ross Dress for Less to Open a New Store in Gonzales, Louisiana
- Ross Dress for Less to Open a New Store in Houston, Texas
- Ross Dress for Less to Open a New Store in Naples, Florida
About author

Online


Add a comment
Comments
0 comments on the analysis ROSS STORES INC. - Daily