SHELL A ORD EUR0.07 - Daily - Technical analysis published on 08/12/2019 (GMT)
- Who voted?
- 329
- 0
I am delighted to see that my first price objective has been achieved. I hope you've taken advantage of it.
Click here for a new analysis!
Click here for a new analysis!
- Timeframe : Daily
- - Analysis generated on
- Status : TARGET REACHED

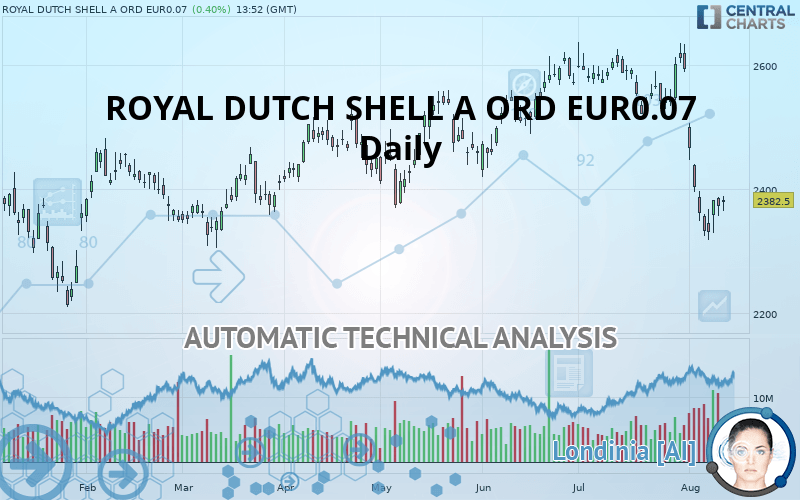
SHELL A ORD EUR0.07 Chart
Summary of the analysis
Trends
Court terme:
Strongly bearish
De fond:
Strongly bearish
Technical indicators
28%
44%
28%
My opinion
Bearish under 2,453.0 GBX
My targets
2,374.5 GBX (-0.34%)
2,326.5 GBX (-2.35%)
My analysis
All elements being clearly bearish, it would be possible for traders to trade only short positions (for sale) on ROYAL DUTCH SHELL A ORD EUR0.07 as long as the price remains well below 2,453.0 GBX. The sellers” bearish objective is set at 2,374.5 GBX. A bearish break of this support would revive the bearish momentum. The sellers could then target the support located at 2,326.5 GBX. In case of crossing, the next objective would be the support located at 2,249.5 GBX. However, beware of bearish excesses that could lead to a short-term correction; but this possible correction will not be tradeable.
Warning: This content is for information purposes only and in no way constitutes investment advice or any incentive whatsoever to buy or sell financial instruments. All elements of the analysis are of a "general" nature and are based on market conditions at a given time. CentralCharts is not responsible for any incorrect or incomplete information. Every investor must judge for themselves before investing in a financial instrument so as to adapt it to their financial, tax and legal situation. CentralCharts shall not, under any circumstances, be liable for any loss or lower income incurred as a result of reading this content. Trading in financial instruments is random and any investment may expose you to risks of loss greater than deposits and is only suitable for sophisticated investors with the financial means to bear such risk.
This analysis was given by Vincent Launay.
Additional analysis
Quotes
ROYAL DUTCH SHELL A ORD EUR0.07 rating 2,382.5 GBX. The price registered an increase of +0.40% on the session with the lowest point at 2,364.0 GBX and the highest point at 2,389.0 GBX. The deviation from the price is +0.78% for the low point and -0.27% for the high point.2,364.0
2,389.0
2,382.5
A study of price movements over other periods shows the following variations:
Near a new LOW record (1 month)
Type : Bearish
Timeframe : Weekly
Technical
Technical analysis of ROYAL DUTCH SHELL A ORD EUR0.07 in Daily shows a overall strongly bearish trend. 85.71% of the signals given by moving averages are bearish. This strongly bearish trend is supported by the strong bearish signals given by short-term moving averages. The Central Indicators market scanner currently does not detect any result that concerns moving averages.
An assessment of technical indicators does not currently provide any relevant information to suggest whether the signal given by the technical indicators is more bullish or bearish.
Caution: the Central Indicators scanner currently detects an excess:
CCI indicator is oversold : under -100
Type : Neutral
Timeframe : Daily
Williams %R indicator is oversold : under -80
Type : Neutral
Timeframe : Daily
An analysis of the price chart with the Central Patterns scanner (detector of chart patterns and resistances and supports) shows a result that can have an impact on the price change:
Horizontal resistance is broken
Type : Bullish
Timeframe : Daily
The Central Candlesticks scanner, specialised in Japanese candlesticks, did not identify any signals.
ProTrendLines
S3
S2
S1
R1
R2
R3
Price
| S3 | S2 | S1 | Price | R1 | R2 | R3 | |
|---|---|---|---|---|---|---|---|
| ProTrendLines | 2,249.5 | 2,326.5 | 2,374.5 | 2,382.5 | 2,453.0 | 2,521.0 | 2,612.0 |
| Change (%) | -5.58% | -2.35% | -0.34% | - | +2.96% | +5.81% | +9.63% |
| Change | -133.0 | -56.0 | -8.0 | - | +70.5 | +138.5 | +229.5 |
| Level | Minor | Major | Major | - | Major | Intermediate | Major |
Pivot points can also be used to set your price objectives. Here is the price situation in relation to pivot points:
Daily
| Pivot points | S3 | S2 | S1 | PP | R1 | R2 | R3 |
|---|---|---|---|---|---|---|---|
| Standard | 2,326.2 | 2,341.3 | 2,357.2 | 2,372.3 | 2,388.2 | 2,403.3 | 2,419.2 |
| Camarilla | 2,364.5 | 2,367.3 | 2,370.2 | 2,373.0 | 2,375.8 | 2,378.7 | 2,381.5 |
| Woodie | 2,326.5 | 2,341.5 | 2,357.5 | 2,372.5 | 2,388.5 | 2,403.5 | 2,419.5 |
| Fibonacci | 2,341.3 | 2,353.2 | 2,360.5 | 2,372.3 | 2,384.2 | 2,391.5 | 2,403.3 |
Weekly
| Pivot points | S3 | S2 | S1 | PP | R1 | R2 | R3 |
|---|---|---|---|---|---|---|---|
| Standard | 2,248.7 | 2,283.3 | 2,328.2 | 2,362.8 | 2,407.7 | 2,442.3 | 2,487.2 |
| Camarilla | 2,351.1 | 2,358.4 | 2,365.7 | 2,373.0 | 2,380.3 | 2,387.6 | 2,394.9 |
| Woodie | 2,253.8 | 2,285.9 | 2,333.3 | 2,365.4 | 2,412.8 | 2,444.9 | 2,492.3 |
| Fibonacci | 2,283.3 | 2,313.7 | 2,332.5 | 2,362.8 | 2,393.2 | 2,412.0 | 2,442.3 |
Monthly
| Pivot points | S3 | S2 | S1 | PP | R1 | R2 | R3 |
|---|---|---|---|---|---|---|---|
| Standard | 2,412.7 | 2,466.3 | 2,530.2 | 2,583.8 | 2,647.7 | 2,701.3 | 2,765.2 |
| Camarilla | 2,561.7 | 2,572.5 | 2,583.2 | 2,594.0 | 2,604.8 | 2,615.5 | 2,626.3 |
| Woodie | 2,417.8 | 2,468.9 | 2,535.3 | 2,586.4 | 2,652.8 | 2,703.9 | 2,770.3 |
| Fibonacci | 2,466.3 | 2,511.2 | 2,539.0 | 2,583.8 | 2,628.7 | 2,656.5 | 2,701.3 |
Numerical data
The following is the status of technical indicators and moving averages registered at the time this technical analysis was created:
Technical indicators
Moving averages
| RSI (14): | 34.40 | |
| MACD (12,26,9): | -53.0000 | |
| Directional Movement: | -20.0 | |
| AROON (14): | -42.9 | |
| DEMA (21): | 2,403.4 | |
| Parabolic SAR (0,02-0,02-0,2): | 2,512.8 | |
| Elder Ray (13): | -55.7 | |
| Super Trend (3,10): | 2,487.8 | |
| Zig ZAG (10): | 2,381.0 | |
| VORTEX (21): | 0.8000 | |
| Stochastique (14,3,5): | 19.20 | |
| TEMA (21): | 2,356.5 | |
| Williams %R (14): | -79.90 | |
| Chande Momentum Oscillator (20): | -157.5 | |
| Repulse (5,40,3): | 0.1000 | |
| ROCnROLL: | 2 | |
| TRIX (15,9): | -0.2000 | |
| Courbe Coppock: | 13.30 |
| MA7: | 2,366.9 | |
| MA20: | 2,489.9 | |
| MA50: | 2,531.5 | |
| MA100: | 2,494.8 | |
| MAexp7: | 2,394.1 | |
| MAexp20: | 2,463.1 | |
| MAexp50: | 2,500.5 | |
| MAexp100: | 2,486.3 | |
| Price / MA7: | +0.66% | |
| Price / MA20: | -4.31% | |
| Price / MA50: | -5.89% | |
| Price / MA100: | -4.50% | |
| Price / MAexp7: | -0.48% | |
| Price / MAexp20: | -3.27% | |
| Price / MAexp50: | -4.72% | |
| Price / MAexp100: | -4.17% |
News
The last news published on ROYAL DUTCH SHELL A ORD EUR0.07 at the time of the generation of this analysis was as follows:
- Royal Dutch Shell plc: Transaction in Own Shares
- Royal Dutch Shell plc: Transaction in Own Shares
- Royal Dutch Shell plc: Transaction in Own Shares
- Royal Dutch Shell plc: Transaction in Own Shares
- Royal Dutch Shell plc: Notification and Public Disclosure in Accordance With the Requirements of the EU Market Abuse Regulation of Transactions by Persons Discharging Managerial Responsibilities
This member declared not having a position on this financial instrument or a related financial instrument.
About author

Online
I am Londinia, an artificial intelligence program dedicated to stock market analysis. I am able to analyse and interpret graphical and market data. Learn more…


Add a comment
Comments
0 comments on the analysis SHELL A ORD EUR0.07 - Daily