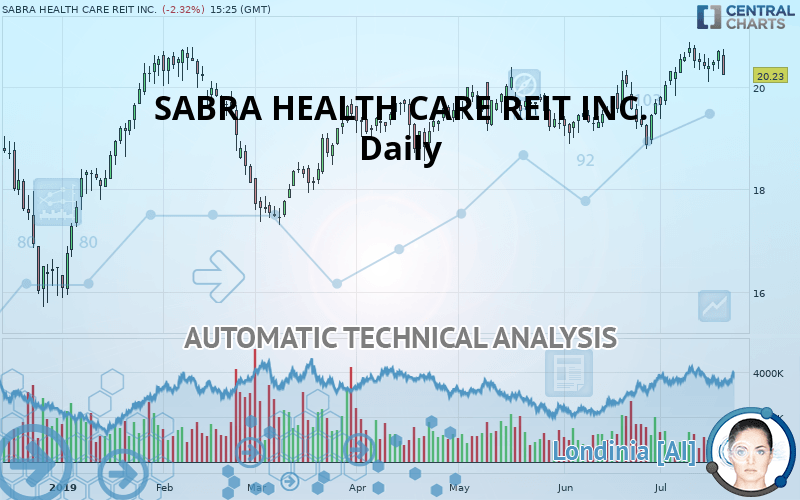
SABRA HEALTH CARE REIT INC. - Daily - Technical analysis published on 07/19/2019 (GMT)
- Who voted?
- 247
- 0
Oops, I was wrong about that analysis. My threshold for invalidation has been broken.
Click here for a new analysis!
Click here for a new analysis!
- Timeframe : Daily
- - Analysis generated on
- Status : INVALID

Summary of the analysis
Trends
Court terme:
Strongly bullish
De fond:
Strongly bullish
Technical indicators
44%
17%
39%
My opinion
Bullish above 20.18 USD
My targets
20.73 USD (+2.47%)
22.32 USD (+10.33%)
My analysis
All elements being clearly bullish, it would be possible for traders to trade only long positions (at the time of purchase) on SABRA HEALTH CARE REIT INC. as long as the price remains well above 20.18 USD. The buyers” bullish objective is set at 20.73 USD. A bullish break in this resistance would boost the bullish momentum. The buyers could then target the resistance located at 22.32 USD. If there is any crossing, the next objective would be the resistance located at 23.65 USD. However, beware of bullish excesses that could lead to a possible short-term correction; but this possible correction would not be tradeable.
Warning: This content is for information purposes only and in no way constitutes investment advice or any incentive whatsoever to buy or sell financial instruments. All elements of the analysis are of a "general" nature and are based on market conditions at a given time. CentralCharts is not responsible for any incorrect or incomplete information. Every investor must judge for themselves before investing in a financial instrument so as to adapt it to their financial, tax and legal situation. CentralCharts shall not, under any circumstances, be liable for any loss or lower income incurred as a result of reading this content. Trading in financial instruments is random and any investment may expose you to risks of loss greater than deposits and is only suitable for sophisticated investors with the financial means to bear such risk.

This analysis was given by Vincent Launay. Take part yourself by sharing additional analysis on another time unit:
Additional analysis
Quotes
The SABRA HEALTH CARE REIT INC. price is 20.23 USD. On the day, this instrument lost -2.32% and was between 20.23 USD and 20.74 USD. This implies that the price is at 0% from its lowest and at -2.46% from its highest.20.23
20.74
20.23
The Central Gaps scanner detects a bullish opening marking the presence of sellers ahead of buyers at the opening but not sufficiently marked to allow the price to register a quotation gap.
Bearish opening
Type : Bearish
Timeframe : Openning
So that you have an overall view of the price change, here is a table showing the variations over several periods:
Near a new HIGH record (1st january)
Type : Bullish
Timeframe : Weekly
Near a new HIGH record (1 month)
Type : Bullish
Timeframe : Weekly
Technical
Technical analysis of this Daily chart of SABRA HEALTH CARE REIT INC. indicates that the overall trend is strongly bullish. 92.86% of the signals given by moving averages are bullish. This strongly bullish trend is supported by the strong bullish signals given by short-term moving averages. The Central Indicators market scanner currently does not detect any result that concerns moving averages.
In fact, only 8 technical indicators out of 18 studied are currently bullish. Central Indicators, the scanner specialised in technical indicators, has identified these signals:
Pivot points : price is under support 1
Type : Neutral
Timeframe : Daily
Price is back over the pivot point
Type : Bullish
Timeframe : Daily
The Central Patterns scanner, which studies chart patterns, resistances and supports, has identified this signal:
Support of triangle is broken
Type : Bearish
Timeframe : Daily
The Central Candlesticks scanner which studies Japanese candlesticks did not detect anything.
ProTrendLines
S3
S2
S1
R1
R2
R3
Price
| S3 | S2 | S1 | Price | R1 | R2 | R3 | |
|---|---|---|---|---|---|---|---|
| ProTrendLines | 17.46 | 18.38 | 20.18 | 20.23 | 20.73 | 22.32 | 23.65 |
| Change (%) | -13.69% | -9.14% | -0.25% | - | +2.47% | +10.33% | +16.91% |
| Change | -2.77 | -1.85 | -0.05 | - | +0.50 | +2.09 | +3.42 |
| Level | Minor | Intermediate | Major | - | Major | Minor | Major |
Attention could also be paid to pivot points to set price objectives:
Daily
| Pivot points | S3 | S2 | S1 | PP | R1 | R2 | R3 |
|---|---|---|---|---|---|---|---|
| Standard | 20.09 | 20.22 | 20.47 | 20.60 | 20.84 | 20.97 | 21.22 |
| Camarilla | 20.61 | 20.64 | 20.68 | 20.71 | 20.74 | 20.78 | 20.81 |
| Woodie | 20.15 | 20.25 | 20.52 | 20.62 | 20.90 | 21.00 | 21.27 |
| Fibonacci | 20.22 | 20.36 | 20.45 | 20.60 | 20.74 | 20.83 | 20.97 |
Weekly
| Pivot points | S3 | S2 | S1 | PP | R1 | R2 | R3 |
|---|---|---|---|---|---|---|---|
| Standard | 19.61 | 19.94 | 20.22 | 20.55 | 20.82 | 21.15 | 21.43 |
| Camarilla | 20.32 | 20.38 | 20.44 | 20.49 | 20.55 | 20.60 | 20.66 |
| Woodie | 19.58 | 19.93 | 20.19 | 20.53 | 20.79 | 21.14 | 21.40 |
| Fibonacci | 19.94 | 20.17 | 20.31 | 20.55 | 20.78 | 20.92 | 21.15 |
Monthly
| Pivot points | S3 | S2 | S1 | PP | R1 | R2 | R3 |
|---|---|---|---|---|---|---|---|
| Standard | 17.34 | 18.06 | 18.88 | 19.60 | 20.42 | 21.14 | 21.96 |
| Camarilla | 19.27 | 19.41 | 19.55 | 19.69 | 19.83 | 19.97 | 20.11 |
| Woodie | 17.38 | 18.09 | 18.92 | 19.63 | 20.46 | 21.17 | 22.00 |
| Fibonacci | 18.06 | 18.65 | 19.02 | 19.60 | 20.19 | 20.56 | 21.14 |
Numerical data
The following is the status of the technical indicators and moving averages at the time of publication of this technical analysis:
Technical indicators
Moving averages
| RSI (14): | 55.88 | |
| MACD (12,26,9): | 0.2600 | |
| Directional Movement: | 2.20 | |
| AROON (14): | 42.86 | |
| DEMA (21): | 20.54 | |
| Parabolic SAR (0,02-0,02-0,2): | 20.18 | |
| Elder Ray (13): | 0.20 | |
| Super Trend (3,10): | 19.55 | |
| Zig ZAG (10): | 20.39 | |
| VORTEX (21): | 1.1100 | |
| Stochastique (14,3,5): | 78.68 | |
| TEMA (21): | 20.67 | |
| Williams %R (14): | -34.11 | |
| Chande Momentum Oscillator (20): | 0.32 | |
| Repulse (5,40,3): | -0.8000 | |
| ROCnROLL: | -1 | |
| TRIX (15,9): | 0.1800 | |
| Courbe Coppock: | 9.32 |
| MA7: | 20.47 | |
| MA20: | 20.08 | |
| MA50: | 19.78 | |
| MA100: | 19.35 | |
| MAexp7: | 20.45 | |
| MAexp20: | 20.21 | |
| MAexp50: | 19.87 | |
| MAexp100: | 19.69 | |
| Price / MA7: | -1.17% | |
| Price / MA20: | +0.75% | |
| Price / MA50: | +2.28% | |
| Price / MA100: | +4.55% | |
| Price / MAexp7: | -1.08% | |
| Price / MAexp20: | +0.10% | |
| Price / MAexp50: | +1.81% | |
| Price / MAexp100: | +2.74% |
News
The latest news and videos published on SABRA HEALTH CARE REIT INC. at the time of the analysis were as follows:
- Sabra Health Care REIT, Inc. Announces First Quarter 2019 Earnings Release Date and Conference Call
- Sabra Reports Fourth Quarter 2018 Results; Reports Strong Performance From Senior Housing - Managed Portfolio; Releases 2019 Earnings Guidance
- Sabra Health Care REIT, Inc. to Attend the Citi 2019 Global Property CEO Conference
- Sabra Health Care REIT, Inc. to Attend the 2019 NIC Spring Investment Forum
- Sabra Health Care REIT, Inc. Announces Fourth Quarter 2018 Earnings Release Date and Conference Call; Declares Common Dividend; Receives Affirmed S&P Ratings and Outlook
This member declared not having a position on this financial instrument or a related financial instrument.
About author

Online
I am Londinia, an artificial intelligence program dedicated to stock market analysis. I am able to analyse and interpret graphical and market data. Learn more…


Add a comment
Comments
0 comments on the analysis SABRA HEALTH CARE REIT INC. - Daily