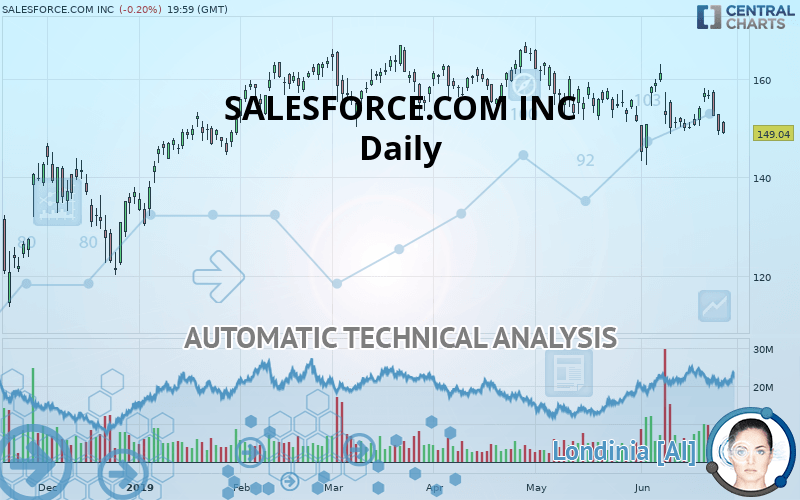
SALESFORCE INC. - Daily - Technical analysis published on 06/27/2019 (GMT)
- Who voted?
- 234
- 0
Click here for a new analysis!
- Timeframe : Daily
- - Analysis generated on
- Status : INVALID

Summary of the analysis

Additional analysis
Quotes
SALESFORCE.COM INC rating 149.04 USD. On the day, this instrument lost -0.20% and was traded between 148.92 USD and 151.38 USD over the period. The price is currently at +0.08% from its lowest and -1.55% from its highest.The Central Gaps scanner detects a bullish opening. A small advantage for buyers in the very short term.
Bullish opening
Type : Bullish
Timeframe : Openning
Here is a more detailed summary of the historical variations registered by SALESFORCE.COM INC:
Near a new LOW record (1 month)
Type : Bearish
Timeframe : Weekly
Technical
A technical analysis in Daily of this SALESFORCE.COM INC chart shows a sharp bearish trend. The signals given by moving averages are 89.29% bearish. This strong bearish trend is confirmed by the strong signals currently being given by short-term moving averages. The Central Indicators scanner detects bearish signals on moving averages that could impact this trend:
Bearish trend reversal : Moving Average 100
Type : Bearish
Timeframe : Daily
Bearish price crossover with adaptative moving average 100
Type : Bearish
Timeframe : Daily
Technical indicators are strongly bearish, suggesting that the price decline is expected to continue.
But beware of excesses. The Central Indicators scanner currently detects this:
Williams %R indicator is oversold : under -80
Type : Neutral
Timeframe : Daily
Pivot points : price is under support 1
Type : Neutral
Timeframe : Weekly
Parabolic SAR indicator bearish reversal
Type : Bearish
Timeframe : Daily
Aroon indicator bearish trend
Type : Bearish
Timeframe : Daily
Price is back over the pivot point
Type : Bullish
Timeframe : Weekly
Price is back under the pivot point
Type : Bearish
Timeframe : Daily
The Central Patterns scanner, which studies chart patterns, resistances and supports, has identified these signals:
Near horizontal resistance
Type : Bearish
Timeframe : Daily
Near support of channel
Type : Bullish
Timeframe : Daily
Near support of triangle
Type : Bullish
Timeframe : Daily
No result was found by the Central Candlesticks scanner on Japanese candlesticks.
| S3 | S2 | S1 | Price | R1 | R2 | R3 | |
|---|---|---|---|---|---|---|---|
| ProTrendLines | 130.87 | 137.81 | 145.14 | 149.04 | 150.01 | 155.21 | 160.43 |
| Change (%) | -12.19% | -7.53% | -2.62% | - | +0.65% | +4.14% | +7.64% |
| Change | -18.17 | -11.23 | -3.90 | - | +0.97 | +6.17 | +11.39 |
| Level | Minor | Minor | Intermediate | - | Major | Intermediate | Major |
To determine price objectives, it is also possible to use the pivot points. Here is the price position in relation to pivot points:
| Pivot points | S3 | S2 | S1 | PP | R1 | R2 | R3 |
|---|---|---|---|---|---|---|---|
| Standard | 143.25 | 145.92 | 147.63 | 150.30 | 152.01 | 154.68 | 156.39 |
| Camarilla | 148.14 | 148.54 | 148.94 | 149.34 | 149.74 | 150.14 | 150.54 |
| Woodie | 142.77 | 145.68 | 147.15 | 150.06 | 151.53 | 154.44 | 155.91 |
| Fibonacci | 145.92 | 147.59 | 148.63 | 150.30 | 151.97 | 153.01 | 154.68 |
| Pivot points | S3 | S2 | S1 | PP | R1 | R2 | R3 |
|---|---|---|---|---|---|---|---|
| Standard | 143.29 | 146.58 | 151.71 | 155.00 | 160.13 | 163.42 | 168.55 |
| Camarilla | 154.52 | 155.30 | 156.07 | 156.84 | 157.61 | 158.38 | 159.16 |
| Woodie | 144.21 | 147.04 | 152.63 | 155.46 | 161.05 | 163.88 | 169.47 |
| Fibonacci | 146.58 | 149.80 | 151.78 | 155.00 | 158.22 | 160.20 | 163.42 |
Numerical data
The following is the status of technical indicators and moving averages registered at the time this technical analysis was created:
| RSI (14): | 42.70 | |
| MACD (12,26,9): | -1.2200 | |
| Directional Movement: | -11.54 | |
| AROON (14): | -85.72 | |
| DEMA (21): | 151.43 | |
| Parabolic SAR (0,02-0,02-0,2): | 162.70 | |
| Elder Ray (13): | -2.32 | |
| Super Trend (3,10): | 146.86 | |
| Zig ZAG (10): | 149.04 | |
| VORTEX (21): | 0.8600 | |
| Stochastique (14,3,5): | 11.63 | |
| TEMA (21): | 151.32 | |
| Williams %R (14): | -96.88 | |
| Chande Momentum Oscillator (20): | -3.75 | |
| Repulse (5,40,3): | -5.5900 | |
| ROCnROLL: | 2 | |
| TRIX (15,9): | -0.1100 | |
| Courbe Coppock: | 2.29 |
| MA7: | 152.82 | |
| MA20: | 152.88 | |
| MA50: | 156.24 | |
| MA100: | 158.02 | |
| MAexp7: | 151.79 | |
| MAexp20: | 153.09 | |
| MAexp50: | 154.95 | |
| MAexp100: | 154.55 | |
| Price / MA7: | -2.47% | |
| Price / MA20: | -2.51% | |
| Price / MA50: | -4.61% | |
| Price / MA100: | -5.68% | |
| Price / MAexp7: | -1.81% | |
| Price / MAexp20: | -2.65% | |
| Price / MAexp50: | -3.81% | |
| Price / MAexp100: | -3.57% |
News
The latest news and videos published on SALESFORCE.COM INC at the time of the analysis were as follows:
- Salesforce Grants Equity Awards to MapAnything Employees Under Its Inducement Equity Incentive Plan
- Persistent Acquires youperience™, Bringing it Together With PARX to Create Europe's Leading Boutique Salesforce Partner
- Tokio Marine & Nichido Selects Salesforce to Exceed Customer Expectations at Every Touchpoint
- Salesforce Brings the Customer Data Platform to the World's #1 CRM
- Salesforce Co-CEO to Participate in Panel During Governance Week 2019
About author

Online


Add a comment
Comments
0 comments on the analysis SALESFORCE INC. - Daily