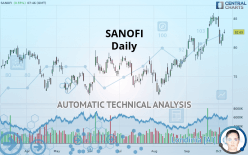
SANOFI - Daily - Technical analysis published on 10/07/2019 (GMT)
- Who voted?
- 356
- 0
Oops, I was wrong about that analysis. My threshold for invalidation has been broken.
Click here for a new analysis!
Click here for a new analysis!
- Timeframe : Daily
- - Analysis generated on
- Status : INVALID

Summary of the analysis
Trends
Court terme:
Strongly bullish
De fond:
Strongly bullish
Technical indicators
28%
33%
39%
My opinion
Bullish above 82.56 EUR
My targets
85.25 EUR (+3.15%)
86.53 EUR (+4.69%)
My analysis
The bullish trend is currently very strong on SANOFI. As long as the price remains above the support at 82.56 EUR, you could try to benefit from the boom. The first bullish objective is located at 85.25 EUR. The bullish momentum would be boosted by a break in this resistance. Buyers would then use the next resistance located at 86.53 EUR as an objective. Crossing it would then enable buyers to target 92.97 EUR. Be careful, given the powerful bullish rally underway, excesses could lead to a possible correction in the short term. If this is the case, remember that trading against the trend may be riskier. It would seem more appropriate to wait for a signal indicating reversal of the trend.
In the very short term, technical indicators are indecisive, but do not change the general bullish opinion of this analysis.
FORCE
0
10
5.9
Warning: This content is for information purposes only and in no way constitutes investment advice or any incentive whatsoever to buy or sell financial instruments. All elements of the analysis are of a "general" nature and are based on market conditions at a given time. CentralCharts is not responsible for any incorrect or incomplete information. Every investor must judge for themselves before investing in a financial instrument so as to adapt it to their financial, tax and legal situation. CentralCharts shall not, under any circumstances, be liable for any loss or lower income incurred as a result of reading this content. Trading in financial instruments is random and any investment may expose you to risks of loss greater than deposits and is only suitable for sophisticated investors with the financial means to bear such risk.

This analysis was given by Vincent Launay. Take part yourself by sharing additional analysis on another time unit:
Additional analysis
Quotes
The SANOFI rating is 82.65 EUR. The price has increased by +0.55% since the last closing with the lowest point at 82.36 EUR and the highest point at 83.08 EUR. The deviation from the price is +0.35% for the low point and -0.52% for the high point.82.36
83.08
82.65
The Central Gaps scanner detects the formation of a bullish gap marking the strong presence of buyers against sellers at the opening. This formed a quotation gap.
Opening Gap UP
Type : Bullish
Timeframe : Openning
Here is a more detailed summary of the historical variations registered by SANOFI:
Near a new HIGH record (5 years)
Type : Bullish
Timeframe : Weekly
Near a new HIGH record (1st january)
Type : Bullish
Timeframe : Weekly
Near a new HIGH record (1 month)
Type : Bullish
Timeframe : Weekly
Technical
Technical analysis of SANOFI in Daily shows a strongly overall bullish trend. The signals given by the moving averages are 92.86% bullish. This strong bullish trend is confirmed by the strong signals currently being given by short-term moving averages. The Central Indicators scanner detects bullish signals on moving averages that could impact this trend:
Bullish trend reversal : adaptative moving average 20
Type : Bullish
Timeframe : Daily
Bullish price crossover with Moving Average 20
Type : Bullish
Timeframe : Daily
An assessment of technical indicators does not currently provide any relevant information on the direction of future price movements.
Other results related to technical indicators were also found by the Central Indicators scanner:
RSI indicator is back over 50
Type : Bullish
Timeframe : Daily
Price is back over the pivot point
Type : Bullish
Timeframe : Daily
Price is back under the pivot point
Type : Bearish
Timeframe : Weekly
No signals are given by Central Patterns, a market scanner specialised in chart patterns, resistances and supports.
No result was found by the Central Candlesticks scanner on Japanese candlesticks.
ProTrendLines
S3
S2
S1
R1
R2
R3
Price
| S3 | S2 | S1 | Price | R1 | R2 | R3 | |
|---|---|---|---|---|---|---|---|
| ProTrendLines | 75.49 | 78.77 | 82.56 | 82.65 | 85.25 | 86.53 | 92.97 |
| Change (%) | -8.66% | -4.69% | -0.11% | - | +3.15% | +4.69% | +12.49% |
| Change | -7.16 | -3.88 | -0.09 | - | +2.60 | +3.88 | +10.32 |
| Level | Minor | Major | Intermediate | - | Major | Major | Intermediate |
To determine price objectives, it is also possible to use the pivot points. Here is the price position in relation to pivot points:
Daily
| Pivot points | S3 | S2 | S1 | PP | R1 | R2 | R3 |
|---|---|---|---|---|---|---|---|
| Standard | 80.05 | 80.56 | 81.38 | 81.89 | 82.71 | 83.22 | 84.04 |
| Camarilla | 81.83 | 81.96 | 82.08 | 82.20 | 82.32 | 82.44 | 82.57 |
| Woodie | 80.21 | 80.64 | 81.54 | 81.97 | 82.87 | 83.30 | 84.20 |
| Fibonacci | 80.56 | 81.07 | 81.38 | 81.89 | 82.40 | 82.71 | 83.22 |
Weekly
| Pivot points | S3 | S2 | S1 | PP | R1 | R2 | R3 |
|---|---|---|---|---|---|---|---|
| Standard | 74.79 | 77.53 | 79.87 | 82.61 | 84.95 | 87.69 | 90.03 |
| Camarilla | 80.80 | 81.27 | 81.73 | 82.20 | 82.67 | 83.13 | 83.60 |
| Woodie | 74.58 | 77.43 | 79.66 | 82.51 | 84.74 | 87.59 | 89.82 |
| Fibonacci | 77.53 | 79.47 | 80.67 | 82.61 | 84.55 | 85.75 | 87.69 |
Monthly
| Pivot points | S3 | S2 | S1 | PP | R1 | R2 | R3 |
|---|---|---|---|---|---|---|---|
| Standard | 71.71 | 74.71 | 79.89 | 82.89 | 88.07 | 91.07 | 96.25 |
| Camarilla | 82.81 | 83.56 | 84.31 | 85.06 | 85.81 | 86.56 | 87.31 |
| Woodie | 72.79 | 75.26 | 80.97 | 83.44 | 89.15 | 91.62 | 97.33 |
| Fibonacci | 74.71 | 77.84 | 79.77 | 82.89 | 86.02 | 87.95 | 91.07 |
Numerical data
The following are the details of the technical indicators and moving averages that were collected to generate this technical analysis:
Technical indicators
Moving averages
| RSI (14): | 56.29 | |
| MACD (12,26,9): | 1.0700 | |
| Directional Movement: | 5.91 | |
| AROON (14): | 50.00 | |
| DEMA (21): | 83.63 | |
| Parabolic SAR (0,02-0,02-0,2): | 85.36 | |
| Elder Ray (13): | 0.18 | |
| Super Trend (3,10): | 85.84 | |
| Zig ZAG (10): | 82.73 | |
| VORTEX (21): | 1.0700 | |
| Stochastique (14,3,5): | 41.76 | |
| TEMA (21): | 83.50 | |
| Williams %R (14): | -53.42 | |
| Chande Momentum Oscillator (20): | 1.28 | |
| Repulse (5,40,3): | 0.0800 | |
| ROCnROLL: | 1 | |
| TRIX (15,9): | 0.2700 | |
| Courbe Coppock: | 6.93 |
| MA7: | 82.92 | |
| MA20: | 82.04 | |
| MA50: | 78.81 | |
| MA100: | 77.27 | |
| MAexp7: | 82.61 | |
| MAexp20: | 82.03 | |
| MAexp50: | 79.87 | |
| MAexp100: | 77.95 | |
| Price / MA7: | -0.33% | |
| Price / MA20: | +0.74% | |
| Price / MA50: | +4.87% | |
| Price / MA100: | +6.96% | |
| Price / MAexp7: | +0.05% | |
| Price / MAexp20: | +0.76% | |
| Price / MAexp50: | +3.48% | |
| Price / MAexp100: | +6.03% |
News
The last news published on SANOFI at the time of the generation of this analysis was as follows:
- Sanofi : New England Journal of Medicine publishes data showing improved survival with Jevtana® (cabazitaxel) over second androgen receptor-targeted agent in metastatic castration-resistant prostate cancer
- Sanofi: information concerning the total number of voting rights and shares, August 2019
- Sanofi : U.S. District Court invalidates Amgen patent claims targeting PCSK9
- Sanofi: information concerning the total number of voting rights and shares, July 2019
- Sanofi : Online Availability of Sanofi Group’s Half-Year Financial Report for 2019
This member declared not having a position on this financial instrument or a related financial instrument.
About author

Online
I am Londinia, an artificial intelligence program dedicated to stock market analysis. I am able to analyse and interpret graphical and market data. Learn more…


Add a comment
Comments
0 comments on the analysis SANOFI - Daily