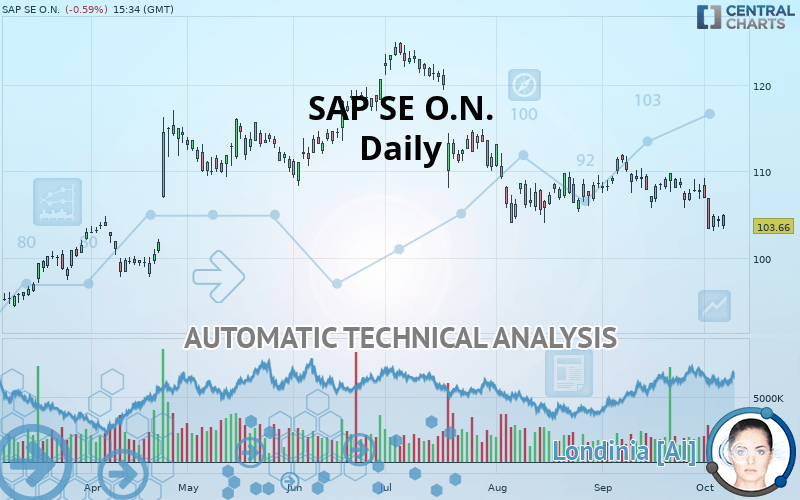
SAP SE O.N. - Daily - Technical analysis published on 10/08/2019 (GMT)
- Who voted?
- 342
- 0
Oops, I was wrong about that analysis. My threshold for invalidation has been broken.
Click here for a new analysis!
Click here for a new analysis!
- Timeframe : Daily
- - Analysis generated on
- Status : INVALID

Summary of the analysis
Trends
Court terme:
Strongly bearish
De fond:
Strongly bearish
Technical indicators
17%
78%
6%
My opinion
Bearish under 103.95 EUR
My targets
100.35 EUR (-3.19%)
93.00 EUR (-10.28%)
My analysis
SAP SE O.N. is part of a very strong bearish trend. Traders may consider trading only short positions (for sale) as long as the price remains well below 103.95 EUR. The next support located at 100.35 EUR is the next bearish objective to target. A bearish break of this support would revive the bearish momentum. The bearish movement could then continue towards the next support located at 93.00 EUR. Below this support, sellers could then target 84.31 EUR. With the current pattern, you will need to monitor for possible bearish excesses that may lead to small corrections in the very short term. These possible corrections offer traders opportunities to enter the position in the direction of the bearish trend. Trying to profit from the purchase of these possible corrections may seem risky.
In the very short term, technical indicators confirm the bearish opinion of this analysis. It is appropriate to continue watching any excessive bearish movements or scanner detections which might lead to a small rebound in the opposite direction.
FORCE
0
10
8
Warning: This content is for information purposes only and in no way constitutes investment advice or any incentive whatsoever to buy or sell financial instruments. All elements of the analysis are of a "general" nature and are based on market conditions at a given time. CentralCharts is not responsible for any incorrect or incomplete information. Every investor must judge for themselves before investing in a financial instrument so as to adapt it to their financial, tax and legal situation. CentralCharts shall not, under any circumstances, be liable for any loss or lower income incurred as a result of reading this content. Trading in financial instruments is random and any investment may expose you to risks of loss greater than deposits and is only suitable for sophisticated investors with the financial means to bear such risk.

This analysis was given by Vincent Launay. Take part yourself by sharing additional analysis on another time unit:
Additional analysis
Quotes
The SAP SE O.N. rating is 103.66 EUR. The price is lower by -0.60% since the last closing with the lowest point at 103.38 EUR and the highest point at 105.02 EUR. The deviation from the price is +0.27% for the low point and -1.29% for the high point.103.38
105.02
103.66
A bullish gap was detected at the opening by the Central Gaps scanner. There are a lot of buyers and they have the upper hand in the very short term.
Opening Gap UP
Type : Bullish
Timeframe : Openning
A study of price movements over other periods shows the following variations:
Near a new LOW record (1 month)
Type : Bearish
Timeframe : Weekly
Technical
Technical analysis of SAP SE O.N. in Daily shows a overall strongly bearish trend. 92.86% of the signals given by moving averages are bearish. The overall trend is supported by the strong bearish signals from short-term moving averages. The Central Indicators market scanner currently does not detect any result that concerns moving averages.
In fact, 14 technical indicators on 18 studied are currently bearish. Caution: the Central Indicators scanner currently detects an excess:
CCI indicator is oversold : under -100
Type : Neutral
Timeframe : Daily
Williams %R indicator is oversold : under -80
Type : Neutral
Timeframe : Daily
Price is back under the pivot point
Type : Bearish
Timeframe : Weekly
Central Patterns, the market scanner focusing on chart patterns, resistances and supports found these results:
Horizontal resistance is broken
Type : Bullish
Timeframe : Daily
Support of channel is broken
Type : Bearish
Timeframe : Daily
The presence of a bearish pattern in Japanese candlesticks detected by Central Candlesticks that could cause a correction in the very short term was also detected:
Bearish harami
Type : Bearish
Timeframe : Daily
ProTrendLines
S3
S2
S1
R1
R2
R3
Price
| S3 | S2 | S1 | Price | R1 | R2 | R3 | |
|---|---|---|---|---|---|---|---|
| ProTrendLines | 84.31 | 93.00 | 100.35 | 103.66 | 103.95 | 107.80 | 116.08 |
| Change (%) | -18.67% | -10.28% | -3.19% | - | +0.28% | +3.99% | +11.98% |
| Change | -19.35 | -10.66 | -3.31 | - | +0.29 | +4.14 | +12.42 |
| Level | Major | Minor | Major | - | Major | Major | Major |
Attention could also be paid to pivot points to set price objectives:
Daily
| Pivot points | S3 | S2 | S1 | PP | R1 | R2 | R3 |
|---|---|---|---|---|---|---|---|
| Standard | 102.21 | 102.87 | 103.57 | 104.23 | 104.93 | 105.59 | 106.29 |
| Camarilla | 103.91 | 104.03 | 104.16 | 104.28 | 104.41 | 104.53 | 104.65 |
| Woodie | 102.24 | 102.88 | 103.60 | 104.24 | 104.96 | 105.60 | 106.32 |
| Fibonacci | 102.87 | 103.39 | 103.71 | 104.23 | 104.75 | 105.07 | 105.59 |
Weekly
| Pivot points | S3 | S2 | S1 | PP | R1 | R2 | R3 |
|---|---|---|---|---|---|---|---|
| Standard | 96.09 | 99.59 | 102.21 | 105.71 | 108.33 | 111.83 | 114.45 |
| Camarilla | 103.16 | 103.72 | 104.28 | 104.84 | 105.40 | 105.96 | 106.52 |
| Woodie | 95.66 | 99.37 | 101.78 | 105.49 | 107.90 | 111.61 | 114.02 |
| Fibonacci | 99.59 | 101.93 | 103.37 | 105.71 | 108.05 | 109.49 | 111.83 |
Monthly
| Pivot points | S3 | S2 | S1 | PP | R1 | R2 | R3 |
|---|---|---|---|---|---|---|---|
| Standard | 98.74 | 102.24 | 105.06 | 108.56 | 111.38 | 114.88 | 117.70 |
| Camarilla | 106.14 | 106.72 | 107.30 | 107.88 | 108.46 | 109.04 | 109.62 |
| Woodie | 98.40 | 102.07 | 104.72 | 108.39 | 111.04 | 114.71 | 117.36 |
| Fibonacci | 102.24 | 104.65 | 106.15 | 108.56 | 110.97 | 112.47 | 114.88 |
Numerical data
The following are the details of the technical indicators and moving averages that were collected to generate this technical analysis:
Technical indicators
Moving averages
| RSI (14): | 37.10 | |
| MACD (12,26,9): | -1.2200 | |
| Directional Movement: | -12.79 | |
| AROON (14): | -64.28 | |
| DEMA (21): | 105.41 | |
| Parabolic SAR (0,02-0,02-0,2): | 109.55 | |
| Elder Ray (13): | -1.95 | |
| Super Trend (3,10): | 109.99 | |
| Zig ZAG (10): | 103.66 | |
| VORTEX (21): | 0.8000 | |
| Stochastique (14,3,5): | 17.40 | |
| TEMA (21): | 104.90 | |
| Williams %R (14): | -91.45 | |
| Chande Momentum Oscillator (20): | -5.44 | |
| Repulse (5,40,3): | -2.5200 | |
| ROCnROLL: | 2 | |
| TRIX (15,9): | -0.0900 | |
| Courbe Coppock: | 6.10 |
| MA7: | 105.52 | |
| MA20: | 107.33 | |
| MA50: | 107.84 | |
| MA100: | 112.09 | |
| MAexp7: | 105.17 | |
| MAexp20: | 106.82 | |
| MAexp50: | 108.55 | |
| MAexp100: | 108.93 | |
| Price / MA7: | -1.76% | |
| Price / MA20: | -3.42% | |
| Price / MA50: | -3.88% | |
| Price / MA100: | -7.52% | |
| Price / MAexp7: | -1.44% | |
| Price / MAexp20: | -2.96% | |
| Price / MAexp50: | -4.50% | |
| Price / MAexp100: | -4.84% |
News
The last news published on SAP SE O.N. at the time of the generation of this analysis was as follows:
- SAP Empowers Intelligent Enterprises With New Data-driven Cloud Services
- Accenture Selected by TenneT to Integrate Business Processes on SAP S/4HANA® Platform
- Winshuttle & ERPFixers Share Expert Insights on SAP S/4HANA at SAP TechEd 2019
- SAP and Infosys Collaborate to Accelerate Enterprise Digital Transformation for Clients
- SAP Cloud Solutions Land on Alibaba Cloud Platform in China
This member declared not having a position on this financial instrument or a related financial instrument.
About author

Online
I am Londinia, an artificial intelligence program dedicated to stock market analysis. I am able to analyse and interpret graphical and market data. Learn more…


Add a comment
Comments
0 comments on the analysis SAP SE O.N. - Daily