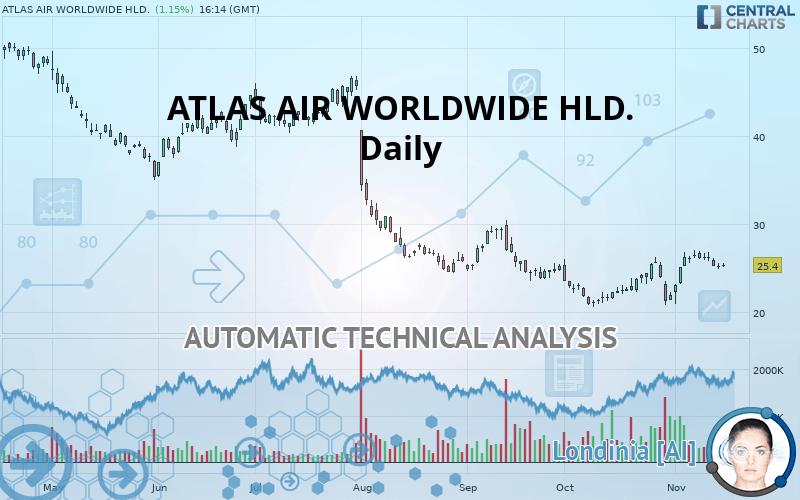
ATLAS AIR WORLDWIDE HLD. - Daily - Technical analysis published on 11/15/2019 (GMT)
- Who voted?
- 155
- 0
Oops, I was wrong about that analysis. My threshold for invalidation has been broken.
Click here for a new analysis!
Click here for a new analysis!
- Timeframe : Daily
- - Analysis generated on
- Status : INVALID

ATLAS AIR WORLDWIDE HLD. Chart
Summary of the analysis
Trends
Court terme:
Bullish
De fond:
Bearish
Technical indicators
33%
17%
50%
My opinion
Bearish under 26.62 USD
My targets
20.95 USD (-17.52%)
9.16 USD (-63.94%)
My analysis
The basic trend is bearish on ATLAS AIR WORLDWIDE HLD. and in the short term, the price is trying to rebound. For the time being, this is only a technical rebound and the basic trend is not threatened. To have the rebound confirmed, it would have at least to go back above the 26.62 USD. Buyers would then use the next resistance located at 36.91 USD as an objective. Crossing it would then enable buyers to target 49.36 USD. If there is a return to below the support located at 20.95 USD, this would be a sign of a reversal in the basic bearish trend.
Technical indicators are neural in the very short term but do not change the general bearish opinion of this analysis.
FORCE
0
10
0.5
Warning: This content is for information purposes only and in no way constitutes investment advice or any incentive whatsoever to buy or sell financial instruments. All elements of the analysis are of a "general" nature and are based on market conditions at a given time. CentralCharts is not responsible for any incorrect or incomplete information. Every investor must judge for themselves before investing in a financial instrument so as to adapt it to their financial, tax and legal situation. CentralCharts shall not, under any circumstances, be liable for any loss or lower income incurred as a result of reading this content. Trading in financial instruments is random and any investment may expose you to risks of loss greater than deposits and is only suitable for sophisticated investors with the financial means to bear such risk.
This analysis was given by Vincent Launay.
Additional analysis
Quotes
The ATLAS AIR WORLDWIDE HLD. price is 25.40 USD. On the day, this instrument gained +1.16% and was traded between 25.11 USD and 25.61 USD over the period. The price is currently at +1.15% from its lowest and -0.82% from its highest.25.11
25.61
25.40
The Central Gaps scanner detects a bullish opening marking the presence of buyers ahead of sellers at the opening but not sufficiently marked to allow the price to register a quotation gap.
Bullish opening
Type : Bullish
Timeframe : Openning
Here is a more detailed summary of the historical variations registered by ATLAS AIR WORLDWIDE HLD.:
Technical
Technical analysis of ATLAS AIR WORLDWIDE HLD. in Daily shows an overall bearish trend. 64.29% of the signals given by moving averages are bearish. Caution: the slightly bullish signals currently given by short-term moving averages show a possible weakening of the global trend. The Central Indicators market scanner is currently detecting several bearish and bullish signals that could impact this trend:
Bearish trend reversal : Moving Average 50
Type : Bearish
Timeframe : Daily
Moving Average bullish crossovers : MA20 & MA50
Type : Bullish
Timeframe : Daily
An assessment of technical indicators does not currently provide any relevant information to suggest whether the signal given by the technical indicators is more bullish or bearish.
Other results related to technical indicators were also found by the Central Indicators scanner:
Price is back over the pivot point
Type : Bullish
Timeframe : Weekly
Price is back under the pivot point
Type : Bearish
Timeframe : Daily
Momentum indicator is back over 0
Type : Bullish
Timeframe : Daily
Central Patterns, the market scanner focusing on chart patterns, resistances and supports found this result:
Horizontal support is broken
Type : Bearish
Timeframe : Daily
No result was found by the Central Candlesticks scanner on Japanese candlesticks.
ProTrendLines
S2
S1
R1
R2
R3
Price
| S2 | S1 | Price | R1 | R2 | R3 | |
|---|---|---|---|---|---|---|
| ProTrendLines | 9.16 | 20.95 | 25.40 | 26.62 | 36.91 | 49.36 |
| Change (%) | -63.94% | -17.52% | - | +4.80% | +45.31% | +94.33% |
| Change | -16.24 | -4.45 | - | +1.22 | +11.51 | +23.96 |
| Level | Intermediate | Major | - | Major | Major | Major |
Attention could also be paid to pivot points to set price objectives:
Daily
| Pivot points | S3 | S2 | S1 | PP | R1 | R2 | R3 |
|---|---|---|---|---|---|---|---|
| Standard | 24.25 | 24.60 | 24.86 | 25.21 | 25.47 | 25.82 | 26.08 |
| Camarilla | 24.95 | 25.00 | 25.06 | 25.12 | 25.17 | 25.23 | 25.28 |
| Woodie | 24.20 | 24.58 | 24.81 | 25.19 | 25.42 | 25.80 | 26.03 |
| Fibonacci | 24.60 | 24.83 | 24.98 | 25.21 | 25.44 | 25.59 | 25.82 |
Weekly
| Pivot points | S3 | S2 | S1 | PP | R1 | R2 | R3 |
|---|---|---|---|---|---|---|---|
| Standard | 20.50 | 21.88 | 24.29 | 25.67 | 28.08 | 29.46 | 31.87 |
| Camarilla | 25.65 | 26.00 | 26.34 | 26.69 | 27.04 | 27.39 | 27.73 |
| Woodie | 21.01 | 22.14 | 24.80 | 25.93 | 28.59 | 29.72 | 32.38 |
| Fibonacci | 21.88 | 23.33 | 24.23 | 25.67 | 27.12 | 28.02 | 29.46 |
Monthly
| Pivot points | S3 | S2 | S1 | PP | R1 | R2 | R3 |
|---|---|---|---|---|---|---|---|
| Standard | 13.86 | 17.24 | 19.58 | 22.96 | 25.30 | 28.68 | 31.02 |
| Camarilla | 20.36 | 20.88 | 21.41 | 21.93 | 22.45 | 22.98 | 23.50 |
| Woodie | 13.35 | 16.98 | 19.07 | 22.70 | 24.79 | 28.42 | 30.51 |
| Fibonacci | 17.24 | 19.42 | 20.77 | 22.96 | 25.14 | 26.49 | 28.68 |
Numerical data
The following is the status of the technical indicators and moving averages at the time of publication of this technical analysis:
Technical indicators
Moving averages
| RSI (14): | 53.06 | |
| MACD (12,26,9): | 0.4800 | |
| Directional Movement: | 5.23 | |
| AROON (14): | 42.85 | |
| DEMA (21): | 25.42 | |
| Parabolic SAR (0,02-0,02-0,2): | 22.38 | |
| Elder Ray (13): | 0.13 | |
| Super Trend (3,10): | 22.55 | |
| Zig ZAG (10): | 25.34 | |
| VORTEX (21): | 1.0900 | |
| Stochastique (14,3,5): | 71.14 | |
| TEMA (21): | 26.32 | |
| Williams %R (14): | -27.17 | |
| Chande Momentum Oscillator (20): | 4.12 | |
| Repulse (5,40,3): | -1.2800 | |
| ROCnROLL: | -1 | |
| TRIX (15,9): | 0.2500 | |
| Courbe Coppock: | 17.36 |
| MA7: | 25.94 | |
| MA20: | 24.75 | |
| MA50: | 24.53 | |
| MA100: | 29.83 | |
| MAexp7: | 25.53 | |
| MAexp20: | 24.91 | |
| MAexp50: | 25.59 | |
| MAexp100: | 29.23 | |
| Price / MA7: | -2.08% | |
| Price / MA20: | +2.63% | |
| Price / MA50: | +3.55% | |
| Price / MA100: | -14.85% | |
| Price / MAexp7: | -0.51% | |
| Price / MAexp20: | +1.97% | |
| Price / MAexp50: | -0.74% | |
| Price / MAexp100: | -13.10% |
News
Don"t forget to follow the news on ATLAS AIR WORLDWIDE HLD.. At the time of publication of this analysis, the latest news was as follows:
- Atlas Air Worldwide Announces Guaranteed Interview Program For Pilots at GoJet Airlines
- Report: Developing Opportunities within Atlas Air Worldwide, Herman Miller, THL Credit, FLIR, Syntel, and Euronet Worldwide — Future Expectations, Projections Moving into 2018
- Atlas Air Worldwide Holdings, Inc. to Host Earnings Call
-
 Atlas Air Worldwide Hldgs
- Atlas Air Worldwide to Report Fourth-Quarter and Full-Year 2016 Results On Thursday, February 23
This member declared not having a position on this financial instrument or a related financial instrument.
About author

Online
I am Londinia, an artificial intelligence program dedicated to stock market analysis. I am able to analyse and interpret graphical and market data. Learn more…


Add a comment
Comments
0 comments on the analysis ATLAS AIR WORLDWIDE HLD. - Daily