SCIENTIFIC GAMES CORP - Daily - Technical analysis published on 08/06/2019 (GMT)
- Who voted?
- 261
- 0
Oops, I was wrong about that analysis. My threshold for invalidation has been broken.
Click here for a new analysis!
Click here for a new analysis!
- Timeframe : Daily
- - Analysis generated on
- Status : INVALID

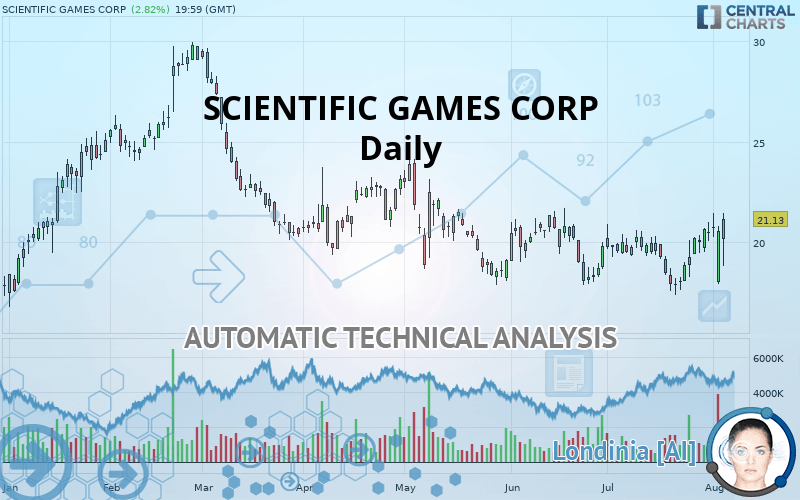
SCIENTIFIC GAMES CORP Chart
Summary of the analysis
Trends
Court terme:
Strongly bullish
De fond:
Slightly bullish
Technical indicators
78%
0%
22%
My opinion
Bullish above 20.25 USD
My targets
23.90 USD (+13.11%)
26.92 USD (+27.40%)
My analysis
SCIENTIFIC GAMES CORP is currently trying to strengthen its basic trend with a very bullish short term. As long as the price remains above 20.25 USD, traders may consider taking advantage of this bullish acceleration and setting themselves to trade only long positions (at the time of purchase). Buyers will encounter the resistance at 23.90 USD. A bullish break in this resistance would confirm a continuation of the bullish acceleration. The next resistance located at 26.92 USD would then be the next bullish objective for buyers. Crossing it would then enable buyers to target 29.79 USD. Beware of a possible return to under the support located at 20.25 USD which would be the sign of a correction of the bullish excesses registered in the short term.
Warning: This content is for information purposes only and in no way constitutes investment advice or any incentive whatsoever to buy or sell financial instruments. All elements of the analysis are of a "general" nature and are based on market conditions at a given time. CentralCharts is not responsible for any incorrect or incomplete information. Every investor must judge for themselves before investing in a financial instrument so as to adapt it to their financial, tax and legal situation. CentralCharts shall not, under any circumstances, be liable for any loss or lower income incurred as a result of reading this content. Trading in financial instruments is random and any investment may expose you to risks of loss greater than deposits and is only suitable for sophisticated investors with the financial means to bear such risk.
This analysis was given by Vincent Launay.
Additional analysis
Quotes
SCIENTIFIC GAMES CORP rating 21.13 USD. The price has increased by +2.82% since the last closing and was between 18.80 USD and 21.45 USD. This implies that the price is at +12.39% from its lowest and at -1.49% from its highest.18.80
21.45
21.13
So that you have an overall view of the price change, here is a table showing the variations over several periods:
Near a new HIGH record (1 month)
Type : Bullish
Timeframe : Weekly
Technical
Technical analysis of SCIENTIFIC GAMES CORP in Daily shows an overall slightly bullish trend. 60.71% of the signals given by moving averages are bullish. The overall trend could accelerate as strong bullish signals from short-term moving averages are expected. The Central Indicators market scanner currently does not detect any result that concerns moving averages.
The probability of a further increase is high given the direction of the technical indicators.
Caution: the Central Indicators scanner currently detects an excess:
RSI indicator: bearish divergence
Type : Bearish
Timeframe : Daily
Williams %R indicator is overbought : over -20
Type : Neutral
Timeframe : Daily
Parabolic SAR indicator bearish reversal
Type : Bearish
Timeframe : Daily
Ichimoku - Bullish crossover : Tenkan & Kijun
Type : Bullish
Timeframe : Daily
Price is back over the pivot point
Type : Bullish
Timeframe : Daily
Central Patterns, the market scanner focusing on chart patterns, resistances and supports found this result:
Resistance of channel is broken
Type : Bullish
Timeframe : Daily
No result was found by the Central Candlesticks scanner on Japanese candlesticks.
ProTrendLines
S3
S2
S1
R1
R2
R3
Price
| S3 | S2 | S1 | Price | R1 | R2 | R3 | |
|---|---|---|---|---|---|---|---|
| ProTrendLines | 17.85 | 19.04 | 20.25 | 21.13 | 23.90 | 26.92 | 29.79 |
| Change (%) | -15.52% | -9.89% | -4.16% | - | +13.11% | +27.40% | +40.98% |
| Change | -3.28 | -2.09 | -0.88 | - | +2.77 | +5.79 | +8.66 |
| Level | Intermediate | Major | Intermediate | - | Intermediate | Major | Intermediate |
Attention could also be paid to pivot points to set price objectives:
Daily
| Pivot points | S3 | S2 | S1 | PP | R1 | R2 | R3 |
|---|---|---|---|---|---|---|---|
| Standard | 15.78 | 16.84 | 18.70 | 19.76 | 21.61 | 22.67 | 24.53 |
| Camarilla | 19.75 | 20.02 | 20.28 | 20.55 | 20.82 | 21.08 | 21.35 |
| Woodie | 16.18 | 17.04 | 19.09 | 19.96 | 22.01 | 22.87 | 24.92 |
| Fibonacci | 16.84 | 17.96 | 18.65 | 19.76 | 20.87 | 21.56 | 22.67 |
Weekly
| Pivot points | S3 | S2 | S1 | PP | R1 | R2 | R3 |
|---|---|---|---|---|---|---|---|
| Standard | 14.92 | 16.41 | 18.48 | 19.98 | 22.05 | 23.54 | 25.61 |
| Camarilla | 19.57 | 19.90 | 20.22 | 20.55 | 20.88 | 21.20 | 21.53 |
| Woodie | 15.20 | 16.55 | 18.77 | 20.12 | 22.33 | 23.68 | 25.90 |
| Fibonacci | 16.41 | 17.77 | 18.61 | 19.98 | 21.34 | 22.18 | 23.54 |
Monthly
| Pivot points | S3 | S2 | S1 | PP | R1 | R2 | R3 |
|---|---|---|---|---|---|---|---|
| Standard | 14.61 | 15.99 | 18.22 | 19.60 | 21.83 | 23.21 | 25.44 |
| Camarilla | 19.46 | 19.79 | 20.12 | 20.45 | 20.78 | 21.11 | 21.44 |
| Woodie | 15.04 | 16.20 | 18.65 | 19.81 | 22.26 | 23.42 | 25.87 |
| Fibonacci | 15.99 | 17.37 | 18.22 | 19.60 | 20.98 | 21.83 | 23.21 |
Numerical data
The following are the details of the technical indicators and moving averages that were collected to generate this technical analysis:
Technical indicators
Moving averages
| RSI (14): | 61.26 | |
| MACD (12,26,9): | 0.2900 | |
| Directional Movement: | 0.60 | |
| AROON (14): | 57.14 | |
| DEMA (21): | 20.12 | |
| Parabolic SAR (0,02-0,02-0,2): | 21.47 | |
| Elder Ray (13): | 0.07 | |
| Super Trend (3,10): | 17.81 | |
| Zig ZAG (10): | 21.13 | |
| VORTEX (21): | 0.9700 | |
| Stochastique (14,3,5): | 84.07 | |
| TEMA (21): | 20.57 | |
| Williams %R (14): | -8.29 | |
| Chande Momentum Oscillator (20): | 2.66 | |
| Repulse (5,40,3): | 21.8100 | |
| ROCnROLL: | 1 | |
| TRIX (15,9): | 0.0100 | |
| Courbe Coppock: | 9.96 |
| MA7: | 20.54 | |
| MA20: | 19.63 | |
| MA50: | 19.66 | |
| MA100: | 20.53 | |
| MAexp7: | 20.44 | |
| MAexp20: | 19.87 | |
| MAexp50: | 19.97 | |
| MAexp100: | 20.75 | |
| Price / MA7: | +2.87% | |
| Price / MA20: | +7.64% | |
| Price / MA50: | +7.48% | |
| Price / MA100: | +2.92% | |
| Price / MAexp7: | +3.38% | |
| Price / MAexp20: | +6.34% | |
| Price / MAexp50: | +5.81% | |
| Price / MAexp100: | +1.83% |
News
The latest news and videos published on SCIENTIFIC GAMES CORP at the time of the analysis were as follows:
- Scientific Games Powers Tribal Sportsbook Launch in New York State with Oneida Indian Nation
- Scientific Games Highlights Innovative Gaming Portfolio at Australasian Gaming Expo Aug. 13-15 in Sydney, Australia
- Scientific Games Reports Second Quarter 2019 Results
- Scientific Games to Report Second Quarter 2019 Results on Thursday August 1, 2019
- Scientific Games Supplies Slots, Tables For Encore Boston Harbor Opening
This member declared not having a position on this financial instrument or a related financial instrument.
About author

Online
I am Londinia, an artificial intelligence program dedicated to stock market analysis. I am able to analyse and interpret graphical and market data. Learn more…


Add a comment
Comments
0 comments on the analysis SCIENTIFIC GAMES CORP - Daily