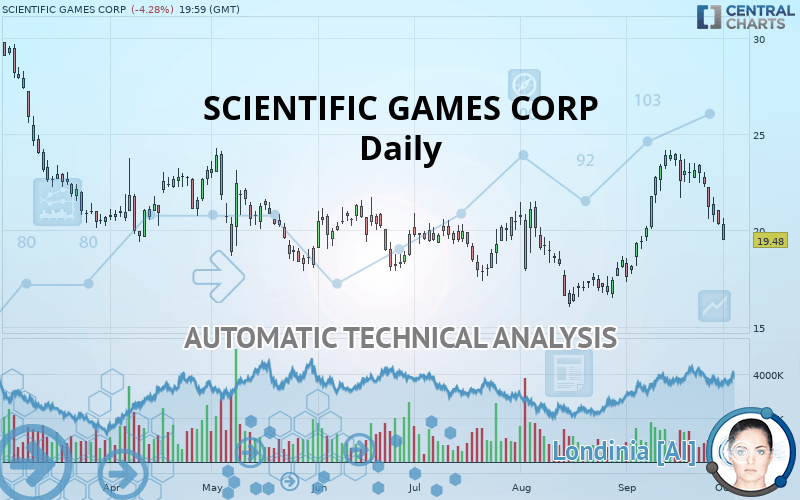
SCIENTIFIC GAMES CORP - Daily - Technical analysis published on 10/02/2019 (GMT)
- Who voted?
- 203
- 0
Click here for a new analysis!
- Timeframe : Daily
- - Analysis generated on
- Status : TARGET REACHED

Summary of the analysis
Additional analysis
Quotes
The SCIENTIFIC GAMES CORP price is 19.48 USD. The price is lower by -4.28% since the last closing with the lowest point at 19.48 USD and the highest point at 20.66 USD. The deviation from the price is 0% for the low point and -5.71% for the high point.The Central Gaps scanner detects a bearish opening. A small advantage for sellers in the very short term.
Bearish opening
Type : Bearish
Timeframe : Openning
So that you have an overall view of the price change, here is a table showing the variations over several periods:
Technical
Technical analysis of SCIENTIFIC GAMES CORP in Daily shows an overall slightly bearish trend. Only 60.71% of the signals given by moving averages are bearish. This slightly bearish trend is not supported by the signals currently being given by short-term moving averages. The Central Indicators scanner detects bearish signals on moving averages that could impact this trend:
Bearish trend reversal : Moving Average 100
Type : Bearish
Timeframe : Daily
Bearish trend reversal : adaptative moving average 50
Type : Bearish
Timeframe : Daily
Bearish trend reversal : adaptative moving average 100
Type : Bearish
Timeframe : Daily
Bearish price crossover with adaptative moving average 50
Type : Bearish
Timeframe : Daily
In fact, 12 technical indicators on 18 studied are currently positioned bearish. But beware of excesses. The Central Indicators scanner currently detects this:
Williams %R indicator is oversold : under -80
Type : Neutral
Timeframe : Daily
Pivot points : price is under support 1
Type : Neutral
Timeframe : Weekly
Pivot points : price is under support 3
Type : Neutral
Timeframe : Daily
An analysis of the price chart with the Central Patterns scanner (detector of chart patterns and resistances and supports) shows a result that can have an impact on the price change:
Near support of channel
Type : Bullish
Timeframe : Daily
Central Candlesticks, the scanner specialised in Japanese candlesticks, detects a bearish signal that could support the hypothesis of a small drop in the very short term:
Three black crows
Type : Bearish
Timeframe : Daily
| S3 | S2 | S1 | Price | R1 | R2 | R3 | |
|---|---|---|---|---|---|---|---|
| ProTrendLines | 16.17 | 17.60 | 19.04 | 19.48 | 21.19 | 23.91 | 25.61 |
| Change (%) | -16.99% | -9.65% | -2.26% | - | +8.78% | +22.74% | +31.47% |
| Change | -3.31 | -1.88 | -0.44 | - | +1.71 | +4.43 | +6.13 |
| Level | Major | Intermediate | Major | - | Major | Major | Minor |
To determine price objectives, it is also possible to use the pivot points. Here is the price position in relation to pivot points:
| Pivot points | S3 | S2 | S1 | PP | R1 | R2 | R3 |
|---|---|---|---|---|---|---|---|
| Standard | 19.27 | 19.76 | 20.06 | 20.55 | 20.85 | 21.34 | 21.64 |
| Camarilla | 20.13 | 20.21 | 20.28 | 20.35 | 20.42 | 20.50 | 20.57 |
| Woodie | 19.17 | 19.71 | 19.96 | 20.50 | 20.75 | 21.29 | 21.54 |
| Fibonacci | 19.76 | 20.07 | 20.25 | 20.55 | 20.86 | 21.04 | 21.34 |
| Pivot points | S3 | S2 | S1 | PP | R1 | R2 | R3 |
|---|---|---|---|---|---|---|---|
| Standard | 16.62 | 18.53 | 19.67 | 21.58 | 22.72 | 24.63 | 25.77 |
| Camarilla | 19.97 | 20.25 | 20.53 | 20.81 | 21.09 | 21.36 | 21.64 |
| Woodie | 16.23 | 18.34 | 19.28 | 21.39 | 22.33 | 24.44 | 25.38 |
| Fibonacci | 18.53 | 19.69 | 20.41 | 21.58 | 22.74 | 23.46 | 24.63 |
| Pivot points | S3 | S2 | S1 | PP | R1 | R2 | R3 |
|---|---|---|---|---|---|---|---|
| Standard | 10.18 | 13.74 | 17.05 | 20.61 | 23.92 | 27.48 | 30.79 |
| Camarilla | 18.46 | 19.09 | 19.72 | 20.35 | 20.98 | 21.61 | 22.24 |
| Woodie | 10.05 | 13.68 | 16.92 | 20.55 | 23.79 | 27.42 | 30.66 |
| Fibonacci | 13.74 | 16.37 | 17.99 | 20.61 | 23.24 | 24.86 | 27.48 |
Numerical data
The following is the status of the technical indicators and moving averages at the time of publication of this technical analysis:
| RSI (14): | 40.00 | |
| MACD (12,26,9): | 0.4000 | |
| Directional Movement: | -12.25 | |
| AROON (14): | -78.57 | |
| DEMA (21): | 21.94 | |
| Parabolic SAR (0,02-0,02-0,2): | 23.50 | |
| Elder Ray (13): | -1.32 | |
| Super Trend (3,10): | 23.38 | |
| Zig ZAG (10): | 19.48 | |
| VORTEX (21): | 1.0500 | |
| Stochastique (14,3,5): | 6.89 | |
| TEMA (21): | 21.83 | |
| Williams %R (14): | -100.00 | |
| Chande Momentum Oscillator (20): | -4.45 | |
| Repulse (5,40,3): | -13.3100 | |
| ROCnROLL: | 2 | |
| TRIX (15,9): | 0.6900 | |
| Courbe Coppock: | 4.55 |
| MA7: | 21.48 | |
| MA20: | 21.77 | |
| MA50: | 19.81 | |
| MA100: | 19.79 | |
| MAexp7: | 21.06 | |
| MAexp20: | 21.21 | |
| MAexp50: | 20.41 | |
| MAexp100: | 20.35 | |
| Price / MA7: | -9.31% | |
| Price / MA20: | -10.52% | |
| Price / MA50: | -1.67% | |
| Price / MA100: | -1.57% | |
| Price / MAexp7: | -7.50% | |
| Price / MAexp20: | -8.16% | |
| Price / MAexp50: | -4.56% | |
| Price / MAexp100: | -4.28% |
News
The last news published on SCIENTIFIC GAMES CORP at the time of the generation of this analysis was as follows:
- Scientific Games Will Supply Latest Generation WAVE™ Lottery Terminals In Italy
- This Is Winning With Scientific Games At NASPL 2019 Conference In Little Rock, Arkansas
- Scientific Games Joint Venture Kicks Off National Sports Betting Program In Turkey, One Of World's Largest Sports Markets
- Scientific Games Selected To Exclusively Supply World-Leading Lottery Instant Games And Latest Generation WAVE™ Retailer Terminals For Turkish National Lottery
- Scientific Games Powers Tribal Sportsbook Launch in New York State with Oneida Indian Nation
About author

Online


Add a comment
Comments
0 comments on the analysis SCIENTIFIC GAMES CORP - Daily