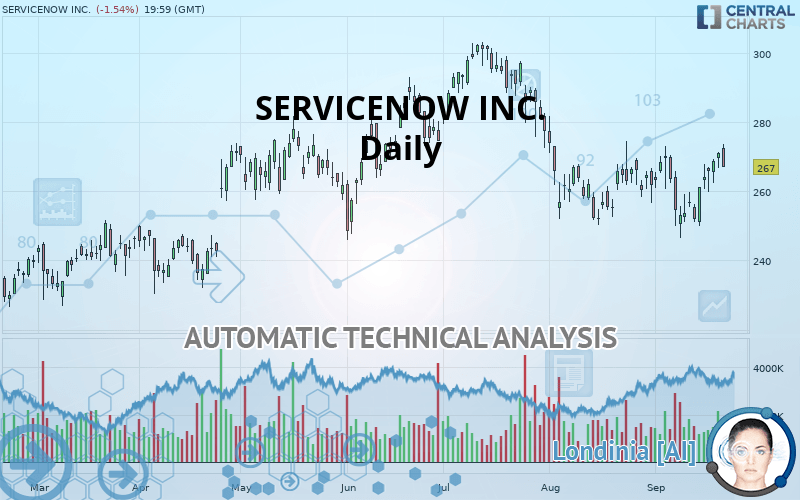
SERVICENOW INC. - Daily - Technical analysis published on 09/24/2019 (GMT)
- Who voted?
- 324
- 0
- Timeframe : Daily
- - Analysis generated on
- Status : NEUTRAL
Summary of the analysis

Additional analysis
Quotes
The SERVICENOW INC. price is 267.00 USD. On the day, this instrument lost -1.54% and was traded between 266.96 USD and 273.63 USD over the period. The price is currently at +0.01% from its lowest and -2.42% from its highest.A bullish gap was detected at the opening by the Central Gaps scanner. There are a lot of buyers and they have the upper hand in the very short term.
Opening Gap UP
Type : Bullish
Timeframe : Openning
A study of price movements over other periods shows the following variations:
Near a new HIGH record (1 month)
Type : Bullish
Timeframe : Weekly
Technical
Technical analysis of this Daily chart of SERVICENOW INC. indicates that the overall trend is not clearly defined. This indecision could turn into a bullish trend due to the bullish signals currently being given by short-term moving averages. The Central Indicators scanner detects bullish signals on moving averages that could impact this trend:
Bullish price crossover with Moving Average 50
Type : Bullish
Timeframe : Daily
Bullish price crossover with adaptative moving average 50
Type : Bullish
Timeframe : Daily
In fact, 10 technical indicators on 18 studied are currently positioned bullish. But beware of excesses. The Central Indicators scanner currently detects this:
CCI indicator is overbought : over 100
Type : Neutral
Timeframe : Daily
Williams %R indicator is overbought : over -20
Type : Neutral
Timeframe : Daily
Pivot points : price is under support 1
Type : Neutral
Timeframe : Daily
Price is back over the pivot point
Type : Bullish
Timeframe : Daily
Price is back over the pivot point
Type : Bullish
Timeframe : Weekly
Central Patterns, the market scanner focusing on chart patterns, resistances and supports found these results:
Near horizontal resistance
Type : Bearish
Timeframe : Daily
Near resistance of channel
Type : Bearish
Timeframe : Daily
The Central Candlesticks scanner which studies Japanese candlesticks did not detect anything.
| S3 | S2 | S1 | Price | R1 | R2 | R3 | |
|---|---|---|---|---|---|---|---|
| ProTrendLines | 204.58 | 236.38 | 252.02 | 267.00 | 277.96 | 289.11 | 302.31 |
| Change (%) | -23.38% | -11.47% | -5.61% | - | +4.10% | +8.28% | +13.22% |
| Change | -62.42 | -30.62 | -14.98 | - | +10.96 | +22.11 | +35.31 |
| Level | Minor | Intermediate | Major | - | Intermediate | Minor | Major |
Pivot points can also be used to set your price objectives. Here is the price situation in relation to pivot points:
| Pivot points | S3 | S2 | S1 | PP | R1 | R2 | R3 |
|---|---|---|---|---|---|---|---|
| Standard | 263.24 | 264.92 | 268.04 | 269.72 | 272.84 | 274.52 | 277.64 |
| Camarilla | 269.85 | 270.29 | 270.73 | 271.17 | 271.61 | 272.05 | 272.49 |
| Woodie | 263.97 | 265.28 | 268.77 | 270.08 | 273.57 | 274.88 | 278.37 |
| Fibonacci | 264.92 | 266.75 | 267.88 | 269.72 | 271.55 | 272.68 | 274.52 |
| Pivot points | S3 | S2 | S1 | PP | R1 | R2 | R3 |
|---|---|---|---|---|---|---|---|
| Standard | 235.59 | 242.80 | 256.98 | 264.19 | 278.37 | 285.58 | 299.76 |
| Camarilla | 265.29 | 267.25 | 269.21 | 271.17 | 273.13 | 275.09 | 277.05 |
| Woodie | 239.09 | 244.54 | 260.48 | 265.93 | 281.87 | 287.32 | 303.26 |
| Fibonacci | 242.80 | 250.97 | 256.02 | 264.19 | 272.36 | 277.41 | 285.58 |
| Pivot points | S3 | S2 | S1 | PP | R1 | R2 | R3 |
|---|---|---|---|---|---|---|---|
| Standard | 215.92 | 233.05 | 247.45 | 264.58 | 278.98 | 296.11 | 310.51 |
| Camarilla | 253.17 | 256.06 | 258.95 | 261.84 | 264.73 | 267.62 | 270.51 |
| Woodie | 214.55 | 232.37 | 246.08 | 263.90 | 277.61 | 295.43 | 309.14 |
| Fibonacci | 233.05 | 245.10 | 252.54 | 264.58 | 276.63 | 284.07 | 296.11 |
Numerical data
The following are the details of the technical indicators and moving averages that were collected to generate this technical analysis:
| RSI (14): | 52.94 | |
| MACD (12,26,9): | -0.1100 | |
| Directional Movement: | 4.09 | |
| AROON (14): | 64.29 | |
| DEMA (21): | 262.34 | |
| Parabolic SAR (0,02-0,02-0,2): | 249.61 | |
| Elder Ray (13): | 6.55 | |
| Super Trend (3,10): | 276.30 | |
| Zig ZAG (10): | 267.00 | |
| VORTEX (21): | 0.9800 | |
| Stochastique (14,3,5): | 83.84 | |
| TEMA (21): | 265.26 | |
| Williams %R (14): | -24.44 | |
| Chande Momentum Oscillator (20): | -2.62 | |
| Repulse (5,40,3): | -0.2400 | |
| ROCnROLL: | 1 | |
| TRIX (15,9): | -0.1100 | |
| Courbe Coppock: | 0.16 |
| MA7: | 264.27 | |
| MA20: | 262.65 | |
| MA50: | 269.37 | |
| MA100: | 272.26 | |
| MAexp7: | 265.47 | |
| MAexp20: | 263.52 | |
| MAexp50: | 266.49 | |
| MAexp100: | 263.90 | |
| Price / MA7: | +1.03% | |
| Price / MA20: | +1.66% | |
| Price / MA50: | -0.88% | |
| Price / MA100: | -1.93% | |
| Price / MAexp7: | +0.58% | |
| Price / MAexp20: | +1.32% | |
| Price / MAexp50: | +0.19% | |
| Price / MAexp100: | +1.17% |
News
Don"t forget to follow the news on SERVICENOW INC.. At the time of publication of this analysis, the latest news was as follows:
- ServiceNow Secures FedRAMP High Authorization
- ServiceNow Named a Leader in Gartner Magic Quadrant for IT Service Management Tools for Sixth Consecutive Year
- ServiceNow Delivers Native Mobile Experiences at Scale for Work
- Deloitte and ServiceNow Announce New Strategic Agreement to Accelerate Enterprise Digital Transformation for Organizations
- Stefanini Reinforces Partnership with ServiceNow at Knowledge19
About author

Online


Add a comment
Comments
0 comments on the analysis SERVICENOW INC. - Daily