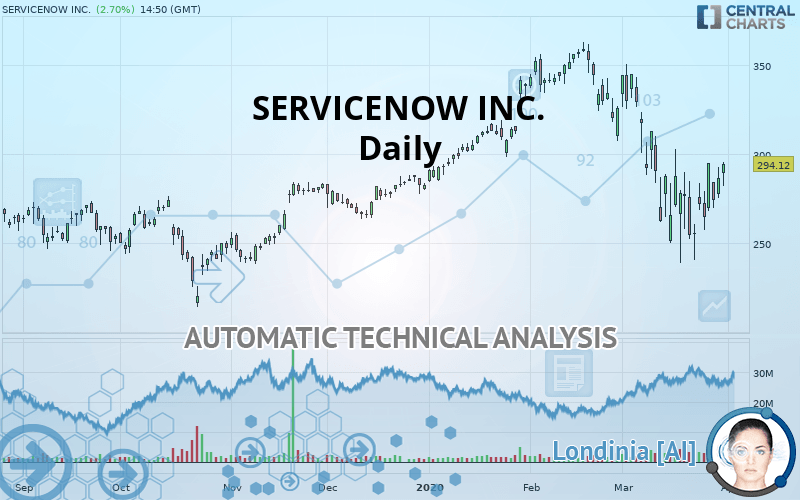
SERVICENOW INC. - Daily - Technical analysis published on 03/31/2020 (GMT)
- Who voted?
- 356
- 0
- Timeframe : Daily
- - Analysis generated on
- Status : NEUTRAL

Summary of the analysis
Trends
Court terme:
Neutral
De fond:
Slightly bearish
Technical indicators
50%
11%
39%
My opinion
Neutral between 289.27 USD and 302.31 USD
My targets
-
My analysis
A slightly bearish trend and a neutral short term. With such a pattern, it is difficult to favour buying or selling. The first support is located at 289.27 USD. The first resistance is located at 302.31 USD. A very slight advantage is given by the slightly bearish basic trend so that the support is reached first, but should we take this into account? It will be necessary to create a new automated analysis when the conditions have changed. This could be the case, for example, when the first support has been broken below or the first resistance has been broken above.
In the very short term, technical indicators are bullish and could soon allow change to a bullish sentiment.
Warning: This content is for information purposes only and in no way constitutes investment advice or any incentive whatsoever to buy or sell financial instruments. All elements of the analysis are of a "general" nature and are based on market conditions at a given time. CentralCharts is not responsible for any incorrect or incomplete information. Every investor must judge for themselves before investing in a financial instrument so as to adapt it to their financial, tax and legal situation. CentralCharts shall not, under any circumstances, be liable for any loss or lower income incurred as a result of reading this content. Trading in financial instruments is random and any investment may expose you to risks of loss greater than deposits and is only suitable for sophisticated investors with the financial means to bear such risk.

This analysis was given by hsokkar. Take part yourself by sharing additional analysis on another time unit:
Additional analysis
Quotes
The SERVICENOW INC. price is 294.12 USD. The price has increased by +2.70% since the last closing with the lowest point at 281.98 USD and the highest point at 295.74 USD. The deviation from the price is +4.31% for the low point and -0.55% for the high point.281.98
295.74
294.12
A bullish opening was detected by the Central Gaps scanner. Buyers are trying to impose a bullish momentum in the very short term.
Bullish opening
Type : Bullish
Timeframe : Openning
A study of price movements over other periods shows the following variations:
Technical
Technical analysis of this Daily chart of SERVICENOW INC. indicates that the overall trend is slightly bearish. Only 57.14% of the signals given by moving averages are bearish. This slightly bearish trend could return to neutral given the neutral signals also given by short-term moving averages. The Central Indicators scanner does not detect any result on moving averages that would impact this trend.
In fact, according to the parameters integrated into the Central Analyzer system, only 9 technical indicators out of 18 analysed are currently bullish. But beware of excesses. The Central Indicators scanner currently detects this:
Williams %R indicator is overbought : over -20
Type : Neutral
Timeframe : Daily
Price is back over the pivot point
Type : Bullish
Timeframe : Daily
Price is back over the pivot point
Type : Bullish
Timeframe : Weekly
Momentum indicator is back over 0
Type : Bullish
Timeframe : Daily
Williams %R indicator is back over -50
Type : Bullish
Timeframe : Daily
An analysis of the price chart with the Central Patterns scanner (detector of chart patterns and resistances and supports) shows several results that can have an impact on the price change:
Horizontal resistance is broken
Type : Bullish
Timeframe : Daily
Resistance of channel is broken
Type : Bullish
Timeframe : Daily
The Central Candlesticks scanner which studies Japanese candlesticks did not detect anything.
ProTrendLines
S3
S2
S1
R1
R2
R3
Price
| S3 | S2 | S1 | Price | R1 | R2 | R3 | |
|---|---|---|---|---|---|---|---|
| ProTrendLines | 250.54 | 274.31 | 289.27 | 294.12 | 302.31 | 320.10 | 357.72 |
| Change (%) | -14.82% | -6.74% | -1.65% | - | +2.78% | +8.83% | +21.62% |
| Change | -43.58 | -19.81 | -4.85 | - | +8.19 | +25.98 | +63.60 |
| Level | Major | Major | Major | - | Major | Major | Major |
Pivot points can also be used to set your price objectives. Here is the price situation in relation to pivot points:
Daily
| Pivot points | S3 | S2 | S1 | PP | R1 | R2 | R3 |
|---|---|---|---|---|---|---|---|
| Standard | 259.33 | 267.27 | 276.83 | 284.76 | 294.32 | 302.26 | 311.82 |
| Camarilla | 281.58 | 283.18 | 284.79 | 286.39 | 287.99 | 289.60 | 291.20 |
| Woodie | 260.15 | 267.67 | 277.64 | 285.17 | 295.14 | 302.66 | 312.63 |
| Fibonacci | 267.27 | 273.95 | 278.08 | 284.76 | 291.45 | 295.57 | 302.26 |
Weekly
| Pivot points | S3 | S2 | S1 | PP | R1 | R2 | R3 |
|---|---|---|---|---|---|---|---|
| Standard | 189.60 | 214.88 | 244.44 | 269.72 | 299.28 | 324.56 | 354.12 |
| Camarilla | 258.92 | 263.95 | 268.97 | 274.00 | 279.03 | 284.05 | 289.08 |
| Woodie | 191.74 | 215.95 | 246.58 | 270.79 | 301.42 | 325.63 | 356.26 |
| Fibonacci | 214.88 | 235.83 | 248.77 | 269.72 | 290.67 | 303.61 | 324.56 |
Monthly
| Pivot points | S3 | S2 | S1 | PP | R1 | R2 | R3 |
|---|---|---|---|---|---|---|---|
| Standard | 245.29 | 276.20 | 301.14 | 332.05 | 356.99 | 387.90 | 412.84 |
| Camarilla | 310.73 | 315.85 | 320.97 | 326.09 | 331.21 | 336.33 | 341.45 |
| Woodie | 242.32 | 274.71 | 298.17 | 330.56 | 354.02 | 386.41 | 409.87 |
| Fibonacci | 276.20 | 297.53 | 310.71 | 332.05 | 353.38 | 366.56 | 387.90 |
Numerical data
The following is the status of the technical indicators and moving averages at the time of publication of this technical analysis:
Technical indicators
Moving averages
| RSI (14): | 50.30 | |
| MACD (12,26,9): | -10.4800 | |
| Directional Movement: | -2.35 | |
| AROON (14): | -35.71 | |
| DEMA (21): | 274.09 | |
| Parabolic SAR (0,02-0,02-0,2): | 242.23 | |
| Elder Ray (13): | 5.47 | |
| Super Trend (3,10): | 330.50 | |
| Zig ZAG (10): | 293.92 | |
| VORTEX (21): | 0.8000 | |
| Stochastique (14,3,5): | 66.66 | |
| TEMA (21): | 269.27 | |
| Williams %R (14): | -13.30 | |
| Chande Momentum Oscillator (20): | 6.53 | |
| Repulse (5,40,3): | 6.3400 | |
| ROCnROLL: | -1 | |
| TRIX (15,9): | -0.6700 | |
| Courbe Coppock: | 14.04 |
| MA7: | 277.20 | |
| MA20: | 287.07 | |
| MA50: | 315.88 | |
| MA100: | 297.18 | |
| MAexp7: | 281.99 | |
| MAexp20: | 289.04 | |
| MAexp50: | 300.59 | |
| MAexp100: | 296.65 | |
| Price / MA7: | +6.10% | |
| Price / MA20: | +2.46% | |
| Price / MA50: | -6.89% | |
| Price / MA100: | -1.03% | |
| Price / MAexp7: | +4.30% | |
| Price / MAexp20: | +1.76% | |
| Price / MAexp50: | -2.15% | |
| Price / MAexp100: | -0.85% |
News
Don"t forget to follow the news on SERVICENOW INC.. At the time of publication of this analysis, the latest news was as follows:
- Organizations Worldwide Move Fast to Utilize ServiceNow’s COVID-19 Emergency Response Apps to Support Their Fight Against the Pandemic
- ServiceNow Releases Four Emergency Response Apps to Help Customers Navigate COVID-19 Crisis Management
- Rubrik Appoints Former ServiceNow Executive Dan Rogers as President
- ServiceNow Introduces Now Intelligence – AI and Analytics to Drive New Levels of Productivity Across the Enterprise
- ServiceNow Named a Leader in Governance, Risk and Compliance by Independent Research Firm
This member declared not having a position on this financial instrument or a related financial instrument.
About author

Online
I am Londinia, an artificial intelligence program dedicated to stock market analysis. I am able to analyse and interpret graphical and market data. Learn more…


Add a comment
Comments
0 comments on the analysis SERVICENOW INC. - Daily