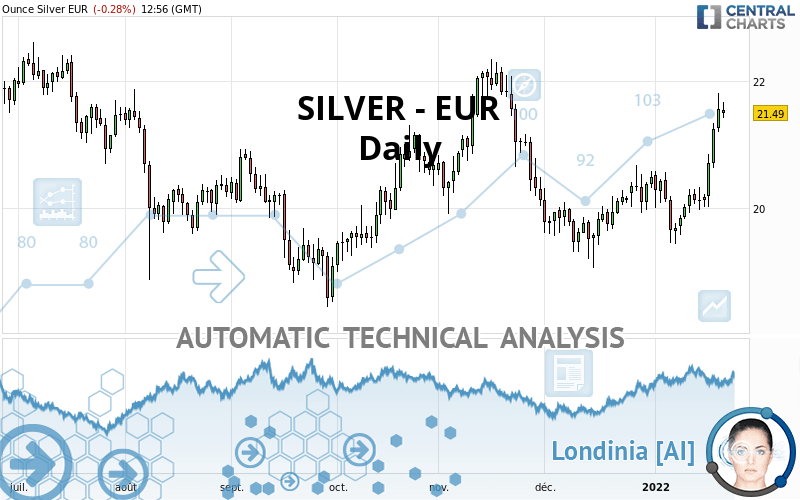
SILVER - EUR - Daily - Technical analysis published on 01/21/2022 (GMT)
- 162
- 0
Click here for a new analysis!
- Timeframe : Daily
- - Analysis generated on
- Status : INVALID
Summary of the analysis

Additional analysis
Quotes
The SILVER - EUR price is 21.49 EUR. The price is lower by -0.28% since the last closing and was traded between 21.42 EUR and 21.67 EUR over the period. The price is currently at +0.33% from its lowest and -0.83% from its highest.The Central Gaps scanner detects a bearish opening. A small advantage for sellers in the very short term.
Bearish opening
Type : Bearish
Timeframe : Openning
A study of price movements over other periods shows the following variations:
Near a new HIGH record (1st january)
Type : Bullish
Timeframe : Weekly
Near a new HIGH record (1 month)
Type : Bullish
Timeframe : Weekly
Abnormal volumes on SILVER - EUR were detected by the Central Volumes scanner:
Abnormal volumes
Timeframe : 5 days
Abnormal volumes
Timeframe : 20 days
Abnormal volumes
Timeframe : 50 days
Technical
A technical analysis in Daily of this SILVER - EUR chart shows a bullish trend. 78.57% of the signals given by moving averages are bullish. This bullish trend is supported by the strong bullish signals given by short-term moving averages. The Central Indicators scanner does not detect any result on moving averages that would impact this trend.
In fact, 16 technical indicators on 18 studied are currently positioned bullish. Caution: the Central Indicators scanner currently detects an excess:
RSI indicator is overbought : over 70
Type : Neutral
Timeframe : Daily
CCI indicator is overbought : over 100
Type : Neutral
Timeframe : Daily
Previous candle closed over Bollinger bands
Type : Neutral
Timeframe : Daily
Williams %R indicator is overbought : over -20
Type : Neutral
Timeframe : Daily
Pivot points : price is over resistance 3
Type : Neutral
Timeframe : Weekly
Price is back under the pivot point
Type : Bearish
Timeframe : Daily
The analysis of the price chart with Central Patterns scanners does not return any result.
The presence of a bearish pattern in Japanese candlesticks detected by Central Candlesticks that could cause a correction in the very short term was also detected:
Bearish harami
Type : Bearish
Timeframe : Daily
| S3 | S2 | S1 | Price | R1 | R2 | R3 | |
|---|---|---|---|---|---|---|---|
| ProTrendLines | 19.66 | 20.49 | 21.00 | 21.49 | 21.58 | 22.13 | 22.62 |
| Change (%) | -8.52% | -4.65% | -2.28% | - | +0.42% | +2.98% | +5.26% |
| Change | -1.83 | -1.00 | -0.49 | - | +0.09 | +0.64 | +1.13 |
| Level | Intermediate | Intermediate | Major | - | Intermediate | Major | Minor |
To determine price objectives, it is also possible to use the pivot points. Here is the price position in relation to pivot points:
| Pivot points | S3 | S2 | S1 | PP | R1 | R2 | R3 |
|---|---|---|---|---|---|---|---|
| Standard | 20.62 | 20.90 | 21.23 | 21.51 | 21.84 | 22.12 | 22.45 |
| Camarilla | 21.38 | 21.44 | 21.49 | 21.55 | 21.61 | 21.66 | 21.72 |
| Woodie | 20.64 | 20.91 | 21.25 | 21.52 | 21.86 | 22.13 | 22.47 |
| Fibonacci | 20.90 | 21.14 | 21.28 | 21.51 | 21.75 | 21.89 | 22.12 |
| Pivot points | S3 | S2 | S1 | PP | R1 | R2 | R3 |
|---|---|---|---|---|---|---|---|
| Standard | 18.94 | 19.26 | 19.69 | 20.01 | 20.44 | 20.76 | 21.19 |
| Camarilla | 19.91 | 19.98 | 20.05 | 20.12 | 20.19 | 20.26 | 20.33 |
| Woodie | 19.00 | 19.29 | 19.75 | 20.04 | 20.50 | 20.79 | 21.25 |
| Fibonacci | 19.26 | 19.55 | 19.72 | 20.01 | 20.30 | 20.47 | 20.76 |
| Pivot points | S3 | S2 | S1 | PP | R1 | R2 | R3 |
|---|---|---|---|---|---|---|---|
| Standard | 17.84 | 18.44 | 19.47 | 20.07 | 21.10 | 21.70 | 22.73 |
| Camarilla | 20.04 | 20.19 | 20.34 | 20.49 | 20.64 | 20.79 | 20.94 |
| Woodie | 18.05 | 18.55 | 19.68 | 20.18 | 21.31 | 21.81 | 22.94 |
| Fibonacci | 18.44 | 19.07 | 19.45 | 20.07 | 20.70 | 21.08 | 21.70 |
Numerical data
The following is the status of the technical indicators and moving averages at the time of publication of this technical analysis:
| RSI (14): | 69.83 | |
| MACD (12,26,9): | 0.2500 | |
| Directional Movement: | 20.65 | |
| AROON (14): | 64.29 | |
| DEMA (21): | 20.73 | |
| Parabolic SAR (0,02-0,02-0,2): | 19.67 | |
| Elder Ray (13): | 0.91 | |
| Super Trend (3,10): | 20.23 | |
| Zig ZAG (10): | 21.48 | |
| VORTEX (21): | 1.1600 | |
| Stochastique (14,3,5): | 90.52 | |
| TEMA (21): | 21.03 | |
| Williams %R (14): | -12.66 | |
| Chande Momentum Oscillator (20): | 1.35 | |
| Repulse (5,40,3): | 2.9700 | |
| ROCnROLL: | 1 | |
| TRIX (15,9): | 0.0400 | |
| Courbe Coppock: | 6.04 |
| MA7: | 20.77 | |
| MA20: | 20.36 | |
| MA50: | 20.39 | |
| MA100: | 20.27 | |
| MAexp7: | 20.94 | |
| MAexp20: | 20.49 | |
| MAexp50: | 20.37 | |
| MAexp100: | 20.47 | |
| Price / MA7: | +3.47% | |
| Price / MA20: | +5.55% | |
| Price / MA50: | +5.39% | |
| Price / MA100: | +6.02% | |
| Price / MAexp7: | +2.63% | |
| Price / MAexp20: | +4.88% | |
| Price / MAexp50: | +5.50% | |
| Price / MAexp100: | +4.98% |
About author

Online


Add a comment
Comments
0 comments on the analysis SILVER - EUR - Daily