10 FRANCS COIN GOLD VALUE USD - Daily - Technical analysis published on 10/08/2019 (GMT)
- Who voted?
- 248
- 0
Click here for a new analysis!
- Timeframe : Daily
- - Analysis generated on
- Status : LEVEL MAINTAINED

Summary of the analysis

Additional analysis
Quotes
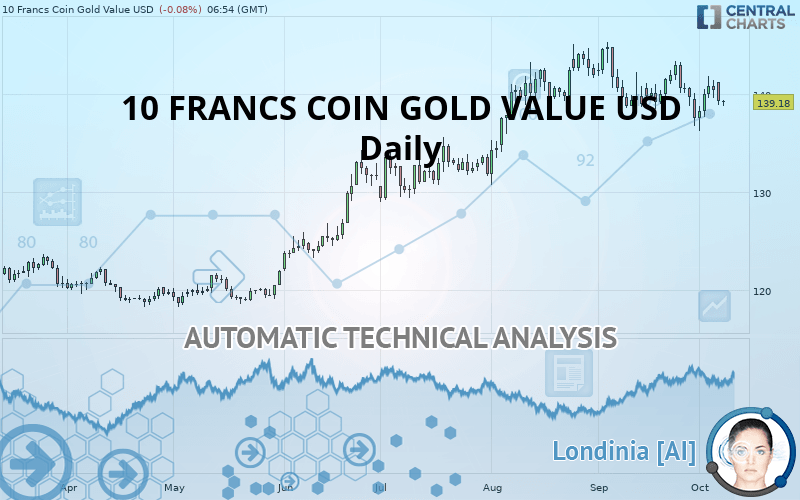
The 10 FRANCS COIN GOLD VALUE USD rating is 139.18 USD. The price registered a decrease of -0.08% on the session and was between 138.84 USD and 139.46 USD. This implies that the price is at +0.24% from its lowest and at -0.20% from its highest.The Central Gaps scanner detects a bullish opening marking the presence of buyers ahead of sellers at the opening but not sufficiently marked to allow the price to register a quotation gap.
Bullish opening
Type : Bullish
Timeframe : Openning
Here is a more detailed summary of the historical variations registered by 10 FRANCS COIN GOLD VALUE USD:
Near a new HIGH record (5 years)
Type : Bullish
Timeframe : Weekly
Near a new HIGH record (1st january)
Type : Bullish
Timeframe : Weekly
Abnormal volumes on 10 FRANCS COIN GOLD VALUE USD were detected by the Central Volumes scanner:
Abnormal volumes
Timeframe : 5 days
Abnormal volumes
Timeframe : 20 days
Abnormal volumes
Timeframe : 50 days
Technical
Technical analysis of this Daily chart of 10 FRANCS COIN GOLD VALUE USD indicates that the overall trend is bullish. The signals given by moving averages are 67.86% bullish. This bullish trend could slow down given the neutral signals currently being given by short-term moving averages. The Central Indicators scanner detects bearish signals on moving averages that could impact this trend:
Bearish trend reversal : adaptative moving average 20
Type : Bearish
Timeframe : Daily
Bearish price crossover with Moving Average 20
Type : Bearish
Timeframe : Daily
Bearish price crossover with Moving Average 50
Type : Bearish
Timeframe : Daily
Bearish price crossover with adaptative moving average 20
Type : Bearish
Timeframe : Daily
Bearish price crossover with adaptative moving average 50
Type : Bearish
Timeframe : Daily
An assessment of technical indicators does not currently provide any relevant information on the direction of future price movements.
Central Indicators, the detector scanner for these technical indicators has recently detected several signals:
RSI indicator is back under 50
Type : Bearish
Timeframe : Daily
Price is back under the pivot point
Type : Bearish
Timeframe : Daily
Momentum indicator is back under 0
Type : Bearish
Timeframe : Daily
Williams %R indicator is back under -50
Type : Bearish
Timeframe : Daily
Central Patterns, the scanner specializing in chart patterns, did not identify any signals.
The Central Candlesticks scanner, specialised in Japanese candlesticks, did not identify any signals.
| S3 | S2 | S1 | Price | R1 | R2 | |
|---|---|---|---|---|---|---|
| ProTrendLines | 127.08 | 131.88 | 138.81 | 139.18 | 144.16 | 178.06 |
| Change (%) | -8.69% | -5.25% | -0.27% | - | +3.58% | +27.94% |
| Change | -12.10 | -7.30 | -0.37 | - | +4.98 | +38.88 |
| Level | Major | Minor | Major | - | Major | Intermediate |
Pivot points can also be used to set your price objectives. Here is the price situation in relation to pivot points:
| Pivot points | S3 | S2 | S1 | PP | R1 | R2 | R3 |
|---|---|---|---|---|---|---|---|
| Standard | 136.09 | 137.50 | 138.40 | 139.81 | 140.71 | 142.12 | 143.02 |
| Camarilla | 138.66 | 138.87 | 139.08 | 139.29 | 139.50 | 139.71 | 139.93 |
| Woodie | 135.83 | 137.37 | 138.14 | 139.68 | 140.45 | 141.99 | 142.76 |
| Fibonacci | 137.50 | 138.39 | 138.93 | 139.81 | 140.70 | 141.24 | 142.12 |
| Pivot points | S3 | S2 | S1 | PP | R1 | R2 | R3 |
|---|---|---|---|---|---|---|---|
| Standard | 131.51 | 133.86 | 137.16 | 139.51 | 142.81 | 145.16 | 148.46 |
| Camarilla | 138.91 | 139.42 | 139.94 | 140.46 | 140.98 | 141.50 | 142.01 |
| Woodie | 131.99 | 134.10 | 137.64 | 139.75 | 143.29 | 145.40 | 148.94 |
| Fibonacci | 133.86 | 136.02 | 137.35 | 139.51 | 141.67 | 143.00 | 145.16 |
| Pivot points | S3 | S2 | S1 | PP | R1 | R2 | R3 |
|---|---|---|---|---|---|---|---|
| Standard | 125.77 | 131.25 | 134.40 | 139.88 | 143.03 | 148.51 | 151.66 |
| Camarilla | 135.19 | 135.98 | 136.77 | 137.56 | 138.35 | 139.14 | 139.93 |
| Woodie | 124.62 | 130.67 | 133.25 | 139.30 | 141.88 | 147.93 | 150.51 |
| Fibonacci | 131.25 | 134.54 | 136.58 | 139.88 | 143.17 | 145.21 | 148.51 |
Numerical data
The following is the status of technical indicators and moving averages registered at the time this technical analysis was created:
| RSI (14): | 46.47 | |
| MACD (12,26,9): | -0.1500 | |
| Directional Movement: | -0.20 | |
| AROON (14): | -35.72 | |
| DEMA (21): | 139.99 | |
| Parabolic SAR (0,02-0,02-0,2): | 141.52 | |
| Elder Ray (13): | -0.77 | |
| Super Trend (3,10): | 144.06 | |
| Zig ZAG (10): | 139.21 | |
| VORTEX (21): | 0.9700 | |
| Stochastique (14,3,5): | 48.07 | |
| TEMA (21): | 139.17 | |
| Williams %R (14): | -58.46 | |
| Chande Momentum Oscillator (20): | -2.39 | |
| Repulse (5,40,3): | -0.8500 | |
| ROCnROLL: | -1 | |
| TRIX (15,9): | -0.0100 | |
| Courbe Coppock: | 0.55 |
| MA7: | 139.38 | |
| MA20: | 140.03 | |
| MA50: | 140.29 | |
| MA100: | 134.26 | |
| MAexp7: | 139.71 | |
| MAexp20: | 140.06 | |
| MAexp50: | 138.84 | |
| MAexp100: | 135.07 | |
| Price / MA7: | -0.14% | |
| Price / MA20: | -0.61% | |
| Price / MA50: | -0.79% | |
| Price / MA100: | +3.66% | |
| Price / MAexp7: | -0.38% | |
| Price / MAexp20: | -0.63% | |
| Price / MAexp50: | +0.24% | |
| Price / MAexp100: | +3.04% |
About author

Online


Add a comment
Comments
0 comments on the analysis 10 FRANCS COIN GOLD VALUE USD - Daily