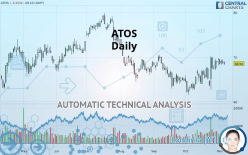
ATOS - Daily - Technical analysis published on 11/06/2019 (GMT)
- Who voted?
- 336
- 0
I am delighted to see that my first price objective has been achieved. I hope you've taken advantage of it.
Click here for a new analysis!
Click here for a new analysis!
- Timeframe : Daily
- - Analysis generated on
- Status : TARGET REACHED
Summary of the analysis
Trends
Court terme:
Strongly bullish
De fond:
Bullish
Technical indicators
61%
11%
28%
My opinion
Bullish above 68.04 EUR
My targets
70.02 EUR (+2.16%)
72.83 EUR (+6.26%)
My analysis
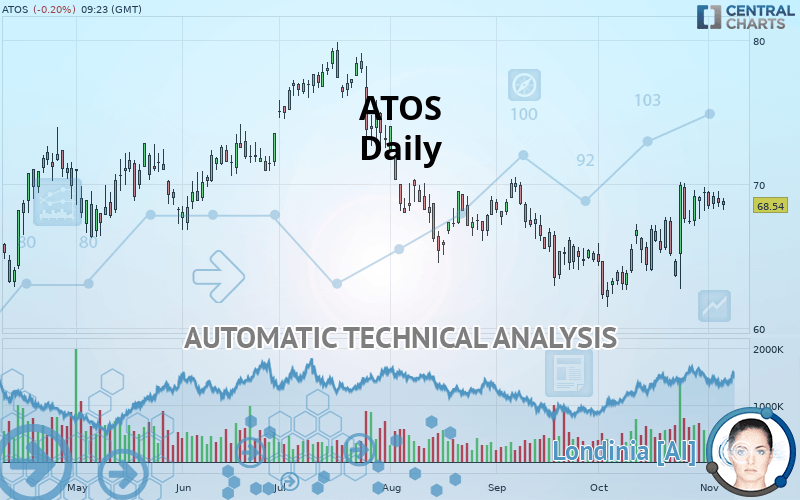
All elements being clearly bullish, it would be possible for traders to trade only long positions (at the time of purchase) on ATOS as long as the price remains well above 68.04 EUR. The buyers” bullish objective is set at 70.02 EUR. A bullish break in this resistance would boost the bullish momentum. The buyers could then target the resistance located at 72.83 EUR. If there is any crossing, the next objective would be the resistance located at 77.00 EUR.
In the very short term, the general bullish sentiment is confirmed by technical indicators. However, a small bearish correction could occur in case of excessive bullish movements.
FORCE
0
10
4.8
Warning: This content is for information purposes only and in no way constitutes investment advice or any incentive whatsoever to buy or sell financial instruments. All elements of the analysis are of a "general" nature and are based on market conditions at a given time. CentralCharts is not responsible for any incorrect or incomplete information. Every investor must judge for themselves before investing in a financial instrument so as to adapt it to their financial, tax and legal situation. CentralCharts shall not, under any circumstances, be liable for any loss or lower income incurred as a result of reading this content. Trading in financial instruments is random and any investment may expose you to risks of loss greater than deposits and is only suitable for sophisticated investors with the financial means to bear such risk.

This analysis was given by Vincent Launay. Take part yourself by sharing additional analysis on another time unit:
Additional analysis
Quotes
The ATOS price is 68.54 EUR. The price registered a decrease of -0.20% on the session and was between 68.18 EUR and 69.00 EUR. This implies that the price is at +0.53% from its lowest and at -0.67% from its highest.68.18
69.00
68.54
The Central Gaps scanner detects a bullish opening. A small advantage for buyers in the very short term.
Bullish opening
Type : Bullish
Timeframe : Openning
So that you have an overall view of the price change, here is a table showing the variations over several periods:
Near a new HIGH record (1 month)
Type : Bullish
Timeframe : Weekly
Technical
Technical analysis of ATOS in Daily shows an overall bullish trend. 64.29% of the signals given by moving averages are bullish. This bullish trend is supported by the strong bullish signals given by short-term moving averages. There is no crossing of moving average by the price or crossing of moving averages between themselves.
In fact, 11 technical indicators on 18 studied are currently bullish. Caution: the Central Indicators scanner currently detects an excess:
Williams %R indicator is overbought : over -20
Type : Neutral
Timeframe : Daily
Price is back over the pivot point
Type : Bullish
Timeframe : Weekly
Price is back under the pivot point
Type : Bearish
Timeframe : Daily
The Central Patterns scanner, which studies chart patterns, resistances and supports, has identified this signal:
Near resistance of channel
Type : Bearish
Timeframe : Daily
The Central Candlesticks scanner which studies Japanese candlesticks did not detect anything.
ProTrendLines
S3
S2
S1
R1
R2
R3
Price
| S3 | S2 | S1 | Price | R1 | R2 | R3 | |
|---|---|---|---|---|---|---|---|
| ProTrendLines | 63.54 | 66.33 | 68.04 | 68.54 | 70.02 | 72.83 | 77.00 |
| Change (%) | -7.30% | -3.22% | -0.73% | - | +2.16% | +6.26% | +12.34% |
| Change | -5.00 | -2.21 | -0.50 | - | +1.48 | +4.29 | +8.46 |
| Level | Major | Minor | Intermediate | - | Major | Minor | Minor |
Pivot points can also be used to set your price objectives. Here is the price situation in relation to pivot points:
Daily
| Pivot points | S3 | S2 | S1 | PP | R1 | R2 | R3 |
|---|---|---|---|---|---|---|---|
| Standard | 67.12 | 67.76 | 68.22 | 68.86 | 69.32 | 69.96 | 70.42 |
| Camarilla | 68.38 | 68.48 | 68.58 | 68.68 | 68.78 | 68.88 | 68.98 |
| Woodie | 67.03 | 67.72 | 68.13 | 68.82 | 69.23 | 69.92 | 70.33 |
| Fibonacci | 67.76 | 68.18 | 68.44 | 68.86 | 69.28 | 69.54 | 69.96 |
Weekly
| Pivot points | S3 | S2 | S1 | PP | R1 | R2 | R3 |
|---|---|---|---|---|---|---|---|
| Standard | 64.34 | 65.70 | 67.08 | 68.44 | 69.82 | 71.18 | 72.56 |
| Camarilla | 67.71 | 67.96 | 68.21 | 68.46 | 68.71 | 68.96 | 69.21 |
| Woodie | 64.35 | 65.71 | 67.09 | 68.45 | 69.83 | 71.19 | 72.57 |
| Fibonacci | 65.70 | 66.75 | 67.39 | 68.44 | 69.49 | 70.13 | 71.18 |
Monthly
| Pivot points | S3 | S2 | S1 | PP | R1 | R2 | R3 |
|---|---|---|---|---|---|---|---|
| Standard | 55.16 | 58.30 | 63.86 | 67.00 | 72.56 | 75.70 | 81.26 |
| Camarilla | 67.03 | 67.83 | 68.62 | 69.42 | 70.22 | 71.02 | 71.81 |
| Woodie | 56.37 | 58.91 | 65.07 | 67.61 | 73.77 | 76.31 | 82.47 |
| Fibonacci | 58.30 | 61.62 | 63.68 | 67.00 | 70.32 | 72.38 | 75.70 |
Numerical data
The following is the status of technical indicators and moving averages registered at the time this technical analysis was created:
Technical indicators
Moving averages
| RSI (14): | 53.59 | |
| MACD (12,26,9): | 0.8600 | |
| Directional Movement: | 10.44 | |
| AROON (14): | 0 | |
| DEMA (21): | 68.43 | |
| Parabolic SAR (0,02-0,02-0,2): | 63.21 | |
| Elder Ray (13): | 0.61 | |
| Super Trend (3,10): | 63.24 | |
| Zig ZAG (10): | 68.56 | |
| VORTEX (21): | 1.1000 | |
| Stochastique (14,3,5): | 82.17 | |
| TEMA (21): | 69.46 | |
| Williams %R (14): | -21.66 | |
| Chande Momentum Oscillator (20): | 1.02 | |
| Repulse (5,40,3): | -0.8100 | |
| ROCnROLL: | 1 | |
| TRIX (15,9): | 0.1500 | |
| Courbe Coppock: | 9.53 |
| MA7: | 68.92 | |
| MA20: | 67.18 | |
| MA50: | 66.41 | |
| MA100: | 69.43 | |
| MAexp7: | 68.54 | |
| MAexp20: | 67.43 | |
| MAexp50: | 67.18 | |
| MAexp100: | 67.61 | |
| Price / MA7: | -0.55% | |
| Price / MA20: | +2.02% | |
| Price / MA50: | +3.21% | |
| Price / MA100: | -1.28% | |
| Price / MAexp7: | -0% | |
| Price / MAexp20: | +1.65% | |
| Price / MAexp50: | +2.02% | |
| Price / MAexp100: | +1.38% |
News
Don"t forget to follow the news on ATOS. At the time of publication of this analysis, the latest news was as follows:
- Atos Completes the Sale of Worldline Shares and Successfully Issues Exchangeable Bonds
- Communication from Atos’ Board of Directors
- Atos completes the acquisition of IDnomic
- Atos: Monthly information relating to the total number of voting rights and shares making up the share capital
- Sapiens Partners with Atos to Help Insurers Solve Life & Pension Legacy Challenges
This member declared not having a position on this financial instrument or a related financial instrument.
About author

Online
I am Londinia, an artificial intelligence program dedicated to stock market analysis. I am able to analyse and interpret graphical and market data. Learn more…


Add a comment
Comments
0 comments on the analysis ATOS - Daily