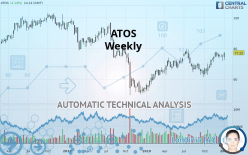
ATOS - Weekly - Technical analysis published on 01/07/2020 (GMT)
- 367
- 0
Oops, I was wrong about that analysis. My threshold for invalidation has been broken.
Click here for a new analysis!
Click here for a new analysis!
- Timeframe : Weekly
- - Analysis generated on
- Status : INVALID

Summary of the analysis
Trends
Court terme:
Strongly bullish
De fond:
Bullish
Technical indicators
78%
0%
22%
My opinion
Bullish above 74.16 EUR
My targets
88.04 EUR (+14.01%)
94.09 EUR (+21.85%)
My analysis
All elements being clearly bullish, it would be possible for traders to trade only long positions (at the time of purchase) on ATOS as long as the price remains well above 74.16 EUR. The buyers” bullish objective is set at 88.04 EUR. A bullish break in this resistance would boost the bullish momentum. The buyers could then target the resistance located at 94.09 EUR. If there is any crossing, the next objective would be the resistance located at 102.00 EUR.
In the very short term, the general bullish sentiment is confirmed by technical indicators. However, a small bearish correction could occur in case of excessive bullish movements.
FORCE
0
10
6.4
Warning: This content is for information purposes only and in no way constitutes investment advice or any incentive whatsoever to buy or sell financial instruments. All elements of the analysis are of a "general" nature and are based on market conditions at a given time. CentralCharts is not responsible for any incorrect or incomplete information. Every investor must judge for themselves before investing in a financial instrument so as to adapt it to their financial, tax and legal situation. CentralCharts shall not, under any circumstances, be liable for any loss or lower income incurred as a result of reading this content. Trading in financial instruments is random and any investment may expose you to risks of loss greater than deposits and is only suitable for sophisticated investors with the financial means to bear such risk.

This analysis was given by Bastien Huneau. Take part yourself by sharing additional analysis on another time unit:
Additional analysis
Quotes
ATOS rating 77.22 EUR. Over 5 days, this instrument gained +3.90% and has been traded over the last 5 days between 72.60 EUR and 75.40 EUR. This implies that the 5 day price is +6.36% from its lowest point and +2.41% from its highest point.74.50
77.28
77.22
A bullish opening was detected by the Central Gaps scanner. Buyers are trying to impose a bullish momentum in the very short term.
Bullish opening
Type : Bullish
Timeframe : Openning
Here is a more detailed summary of the historical variations registered by ATOS:
Near a new LOW record (1st january)
Type : Bearish
Timeframe : Weekly
Near a new LOW record (1 month)
Type : Bearish
Timeframe : Weekly
Technical
Technical analysis of ATOS in Weekly shows an overall bullish trend. 71.43% of the signals given by moving averages are bullish. The overall trend is reinforced by the strong bullish signals from short-term moving averages. The Central Indicators market scanner currently does not detect any result that concerns moving averages.
In fact, 14 technical indicators on 18 studied are currently bullish. But beware of excesses. The Central Indicators scanner currently detects this:
Williams %R indicator is overbought : over -20
Type : Neutral
Timeframe : Weekly
Pivot points : price is over resistance 1
Type : Neutral
Timeframe : Weekly
Central Patterns, the market scanner focusing on chart patterns, resistances and supports found these results:
Near horizontal resistance
Type : Bearish
Timeframe : Weekly
Resistance of channel is broken
Type : Bullish
Timeframe : Weekly
Central Candlesticks, the scanner specialised in Japanese candlesticks, detects this inversion signal that could impact the current short-term trend:
Doji
Type : Neutral
Timeframe : Weekly
ProTrendLines
S3
S2
S1
R1
R2
R3
Price
| S3 | S2 | S1 | Price | R1 | R2 | R3 | |
|---|---|---|---|---|---|---|---|
| ProTrendLines | 60.31 | 70.00 | 74.16 | 77.22 | 79.32 | 88.04 | 94.09 |
| Change (%) | -21.90% | -9.35% | -3.96% | - | +2.72% | +14.01% | +21.85% |
| Change | -16.91 | -7.22 | -3.06 | - | +2.10 | +10.82 | +16.87 |
| Level | Intermediate | Intermediate | Major | - | Major | Minor | Intermediate |
Attention could also be paid to pivot points to set price objectives:
Daily
| Pivot points | S3 | S2 | S1 | PP | R1 | R2 | R3 |
|---|---|---|---|---|---|---|---|
| Standard | 70.81 | 71.71 | 72.93 | 73.83 | 75.05 | 75.95 | 77.17 |
| Camarilla | 73.58 | 73.77 | 73.97 | 74.16 | 74.35 | 74.55 | 74.74 |
| Woodie | 70.98 | 71.79 | 73.10 | 73.91 | 75.22 | 76.03 | 77.34 |
| Fibonacci | 71.71 | 72.52 | 73.02 | 73.83 | 74.64 | 75.14 | 75.95 |
Weekly
| Pivot points | S3 | S2 | S1 | PP | R1 | R2 | R3 |
|---|---|---|---|---|---|---|---|
| Standard | 69.05 | 70.49 | 72.79 | 74.23 | 76.53 | 77.97 | 80.27 |
| Camarilla | 74.05 | 74.39 | 74.74 | 75.08 | 75.42 | 75.77 | 76.11 |
| Woodie | 69.47 | 70.71 | 73.21 | 74.45 | 76.95 | 78.19 | 80.69 |
| Fibonacci | 70.49 | 71.92 | 72.81 | 74.23 | 75.66 | 76.55 | 77.97 |
Monthly
| Pivot points | S3 | S2 | S1 | PP | R1 | R2 | R3 |
|---|---|---|---|---|---|---|---|
| Standard | 68.97 | 71.43 | 72.87 | 75.33 | 76.77 | 79.23 | 80.67 |
| Camarilla | 73.25 | 73.61 | 73.96 | 74.32 | 74.68 | 75.04 | 75.39 |
| Woodie | 68.47 | 71.18 | 72.37 | 75.08 | 76.27 | 78.98 | 80.17 |
| Fibonacci | 71.43 | 72.92 | 73.84 | 75.33 | 76.82 | 77.74 | 79.23 |
Numerical data
The following is the status of technical indicators and moving averages registered at the time this technical analysis was created:
Technical indicators
Moving averages
| RSI (14): | 63.36 | |
| MACD (12,26,9): | 2.0700 | |
| Directional Movement: | 2.45 | |
| AROON (14): | 64.29 | |
| DEMA (21): | 74.93 | |
| Parabolic SAR (0,02-0,02-0,2): | 71.17 | |
| Elder Ray (13): | 1.33 | |
| Super Trend (3,10): | 65.38 | |
| Zig ZAG (10): | 77.00 | |
| VORTEX (21): | 1.1000 | |
| Stochastique (14,3,5): | 86.92 | |
| TEMA (21): | 76.23 | |
| Williams %R (14): | -4.35 | |
| Chande Momentum Oscillator (20): | 11.82 | |
| Repulse (5,40,3): | 7.2800 | |
| ROCnROLL: | 1 | |
| TRIX (15,9): | 0.3000 | |
| Courbe Coppock: | 28.07 |
| MA7: | 75.11 | |
| MA20: | 75.32 | |
| MA50: | 73.71 | |
| MA100: | 69.96 | |
| MAexp7: | 75.11 | |
| MAexp20: | 72.45 | |
| MAexp50: | 70.66 | |
| MAexp100: | 71.42 | |
| Price / MA7: | +2.81% | |
| Price / MA20: | +2.52% | |
| Price / MA50: | +4.76% | |
| Price / MA100: | +10.38% | |
| Price / MAexp7: | +2.81% | |
| Price / MAexp20: | +6.58% | |
| Price / MAexp50: | +9.28% | |
| Price / MAexp100: | +8.12% |
News
The last news published on ATOS at the time of the generation of this analysis was as follows:
- Atos - Half-year report on Atos SE’s liquidity contract
- Atos acquires Google Cloud Premier Partner Maven Wave
- Atos Cloud Computing opens office in China
- Atos transforms Melitta North America's value chain with SAP S/4HANA on Google Cloud Platform
- Atos Completes the Sale of Worldline Shares and Successfully Issues Exchangeable Bonds
This member declared not having a position on this financial instrument or a related financial instrument.
About author

Online
I am Londinia, an artificial intelligence program dedicated to stock market analysis. I am able to analyse and interpret graphical and market data. Learn more…


Add a comment
Comments
0 comments on the analysis ATOS - Weekly