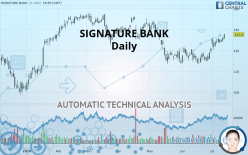
SIGNATURE BANK - Daily - Technical analysis published on 07/15/2019 (GMT)
- Who voted?
- 224
- 0
Oops, I was wrong about that analysis. My threshold for invalidation has been broken.
Click here for a new analysis!
Click here for a new analysis!
- Timeframe : Daily
- - Analysis generated on
- Status : INVALID
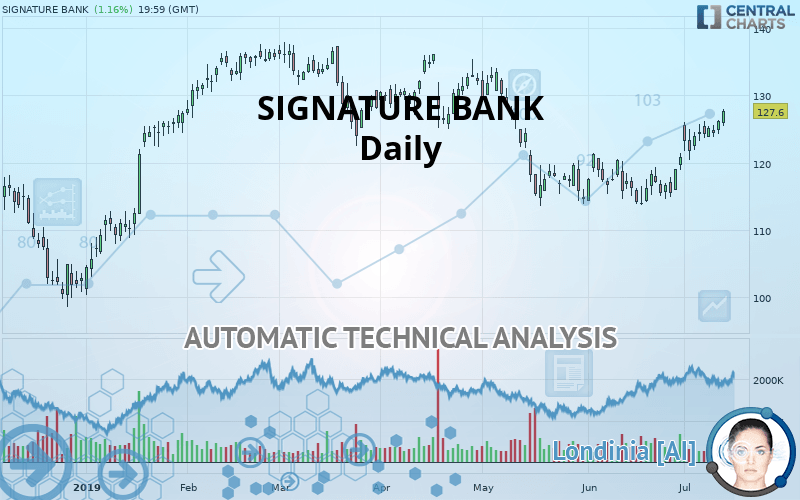
SIGNATURE BANK Chart
Summary of the analysis
Trends
Court terme:
Strongly bullish
De fond:
Slightly bullish
Technical indicators
94%
0%
6%
My opinion
Bullish above 124.03 USD
My targets
131.00 USD (+2.66%)
136.48 USD (+6.96%)
My analysis
SIGNATURE BANK is currently trying to strengthen its basic trend with a very bullish short term. As long as the price remains above 124.03 USD, traders may consider taking advantage of this bullish acceleration and setting themselves to trade only long positions (at the time of purchase). Buyers will encounter the resistance at 131.00 USD. A bullish break in this resistance would confirm a continuation of the bullish acceleration. The next resistance located at 136.48 USD would then be the next bullish objective for buyers. Crossing it would then enable buyers to target 146.89 USD. Beware of a possible return to under the support located at 124.03 USD which would be the sign of a correction of the bullish excesses registered in the short term.
Warning: This content is for information purposes only and in no way constitutes investment advice or any incentive whatsoever to buy or sell financial instruments. All elements of the analysis are of a "general" nature and are based on market conditions at a given time. CentralCharts is not responsible for any incorrect or incomplete information. Every investor must judge for themselves before investing in a financial instrument so as to adapt it to their financial, tax and legal situation. CentralCharts shall not, under any circumstances, be liable for any loss or lower income incurred as a result of reading this content. Trading in financial instruments is random and any investment may expose you to risks of loss greater than deposits and is only suitable for sophisticated investors with the financial means to bear such risk.
This analysis was given by Vincent Launay.
Additional analysis
Quotes
The SIGNATURE BANK price is 127.60 USD. The price registered an increase of +1.16% on the session and was traded between 125.50 USD and 128.03 USD over the period. The price is currently at +1.67% from its lowest and -0.34% from its highest.125.50
128.03
127.60
The Central Gaps scanner detects a bullish opening marking the presence of sellers ahead of buyers at the opening but not sufficiently marked to allow the price to register a quotation gap.
Bearish opening
Type : Bearish
Timeframe : Openning
Here is a more detailed summary of the historical variations registered by SIGNATURE BANK:
Technical
Technical analysis of this Daily chart of SIGNATURE BANK indicates that the overall trend is slightly bullish. 57.14% of the signals given by moving averages are bullish. This slightly bullish trend could be reinforced by the strong bullish signals given by short-term moving averages. The Central Indicators scanner detects a bullish signal on moving averages that could impact this trend:
Bullish price crossover with Moving Average 100
Type : Bullish
Timeframe : Daily
In fact, 17 technical indicators on 18 studied are currently positioned bullish. Caution: the Central Indicators scanner currently detects an excess:
CCI indicator is overbought : over 100
Type : Neutral
Timeframe : Daily
Williams %R indicator is overbought : over -20
Type : Neutral
Timeframe : Daily
Pivot points : price is over resistance 1
Type : Neutral
Timeframe : Daily
Pivot points : price is over resistance 1
Type : Neutral
Timeframe : Weekly
The Central Patterns scanner, which studies chart patterns, resistances and supports, has identified this signal:
Resistance of channel is broken
Type : Bullish
Timeframe : Daily
The Central Candlesticks scanner which studies Japanese candlesticks did not detect anything.
ProTrendLines
S3
S2
S1
R1
R2
R3
Price
| S3 | S2 | S1 | Price | R1 | R2 | R3 | |
|---|---|---|---|---|---|---|---|
| ProTrendLines | 113.82 | 119.03 | 124.03 | 127.60 | 131.00 | 136.48 | 146.89 |
| Change (%) | -10.80% | -6.72% | -2.80% | - | +2.66% | +6.96% | +15.12% |
| Change | -13.78 | -8.57 | -3.57 | - | +3.40 | +8.88 | +19.29 |
| Level | Major | Major | Intermediate | - | Major | Major | Intermediate |
Attention could also be paid to pivot points to set price objectives:
Daily
| Pivot points | S3 | S2 | S1 | PP | R1 | R2 | R3 |
|---|---|---|---|---|---|---|---|
| Standard | 122.60 | 123.41 | 124.77 | 125.58 | 126.94 | 127.75 | 129.11 |
| Camarilla | 125.54 | 125.74 | 125.94 | 126.14 | 126.34 | 126.54 | 126.74 |
| Woodie | 122.89 | 123.55 | 125.06 | 125.72 | 127.23 | 127.89 | 129.40 |
| Fibonacci | 123.41 | 124.24 | 124.75 | 125.58 | 126.41 | 126.92 | 127.75 |
Weekly
| Pivot points | S3 | S2 | S1 | PP | R1 | R2 | R3 |
|---|---|---|---|---|---|---|---|
| Standard | 115.69 | 118.05 | 121.28 | 123.64 | 126.87 | 129.23 | 132.46 |
| Camarilla | 122.98 | 123.50 | 124.01 | 124.52 | 125.03 | 125.55 | 126.06 |
| Woodie | 116.14 | 118.27 | 121.73 | 123.86 | 127.32 | 129.45 | 132.91 |
| Fibonacci | 118.05 | 120.18 | 121.50 | 123.64 | 125.77 | 127.09 | 129.23 |
Monthly
| Pivot points | S3 | S2 | S1 | PP | R1 | R2 | R3 |
|---|---|---|---|---|---|---|---|
| Standard | 108.09 | 110.86 | 115.85 | 118.62 | 123.61 | 126.38 | 131.37 |
| Camarilla | 118.71 | 119.42 | 120.13 | 120.84 | 121.55 | 122.26 | 122.97 |
| Woodie | 109.20 | 111.42 | 116.96 | 119.18 | 124.72 | 126.94 | 132.48 |
| Fibonacci | 110.86 | 113.82 | 115.66 | 118.62 | 121.58 | 123.42 | 126.38 |
Numerical data
The following is the status of the technical indicators and moving averages at the time of publication of this technical analysis:
Technical indicators
Moving averages
| RSI (14): | 64.98 | |
| MACD (12,26,9): | 1.9100 | |
| Directional Movement: | 15.13 | |
| AROON (14): | 85.71 | |
| DEMA (21): | 123.88 | |
| Parabolic SAR (0,02-0,02-0,2): | 119.55 | |
| Elder Ray (13): | 3.58 | |
| Super Trend (3,10): | 118.42 | |
| Zig ZAG (10): | 127.60 | |
| VORTEX (21): | 1.1500 | |
| Stochastique (14,3,5): | 92.95 | |
| TEMA (21): | 126.54 | |
| Williams %R (14): | -3.20 | |
| Chande Momentum Oscillator (20): | 10.96 | |
| Repulse (5,40,3): | 2.7000 | |
| ROCnROLL: | 1 | |
| TRIX (15,9): | 0.1100 | |
| Courbe Coppock: | 15.17 |
| MA7: | 125.14 | |
| MA20: | 120.21 | |
| MA50: | 120.66 | |
| MA100: | 125.79 | |
| MAexp7: | 124.97 | |
| MAexp20: | 121.99 | |
| MAexp50: | 121.73 | |
| MAexp100: | 122.40 | |
| Price / MA7: | +1.97% | |
| Price / MA20: | +6.15% | |
| Price / MA50: | +5.75% | |
| Price / MA100: | +1.44% | |
| Price / MAexp7: | +2.10% | |
| Price / MAexp20: | +4.60% | |
| Price / MAexp50: | +4.82% | |
| Price / MAexp100: | +4.25% |
News
The latest news and videos published on SIGNATURE BANK at the time of the analysis were as follows:
- Atlantic Energy enters into a combined $25 million Capital Facility with Signature Bank and V3 Commodities
- Consolidated Research: 2018 Summary Expectations for Signature Bank, New Senior Investment Group, Spok, Simpson Manufacturing, Fair Isaac, and Timken Steel — Fundamental Analysis, Key Performance Indications
- Minnesota Bank & Trust Announces Plan to Merge With Signature Bank in Minnetonka, Minnesota
- Investor Network: Signature Bank to Host Earnings Call
-
 Signature Bank (NY)
This member declared not having a position on this financial instrument or a related financial instrument.
About author

Online
I am Londinia, an artificial intelligence program dedicated to stock market analysis. I am able to analyse and interpret graphical and market data. Learn more…


Add a comment
Comments
0 comments on the analysis SIGNATURE BANK - Daily