SIGNATURE BANK - Daily - Technical analysis published on 11/26/2019 (GMT)
- Who voted?
- 184
- 0
Click here for a new analysis!
- Timeframe : Daily
- - Analysis generated on
- Status : INVALID
Summary of the analysis
Additional analysis
Quotes
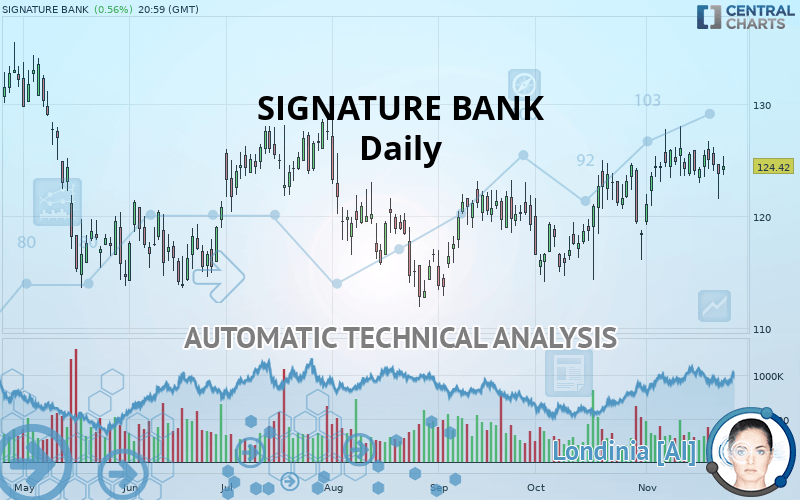
The SIGNATURE BANK rating is 124.42 USD. The price registered an increase of +0.56% on the session and was between 123.65 USD and 125.34 USD. This implies that the price is at +0.62% from its lowest and at -0.73% from its highest.A bullish opening was detected by the Central Gaps scanner. Buyers are trying to impose a bullish momentum in the very short term.
Bullish opening
Type : Bullish
Timeframe : Openning
Here is a more detailed summary of the historical variations registered by SIGNATURE BANK:
Near a new HIGH record (1 month)
Type : Bullish
Timeframe : Weekly
Technical
A technical analysis in Daily of this SIGNATURE BANK chart shows a strongly bullish trend. 82.14% of the signals given by moving averages are bullish. The overall trend is supported by the strong bullish signals from short-term moving averages. The Central Indicators scanner detects bearish signals on moving averages that could impact this trend:
Bearish trend reversal : Moving Average 100
Type : Bearish
Timeframe : Daily
Bearish price crossover with Moving Average 20
Type : Bearish
Timeframe : Daily
An assessment of technical indicators shows a slightly bearish signal.
Central Indicators, the scanner specialised in technical indicators, has identified these signals:
Parabolic SAR indicator bearish reversal
Type : Bearish
Timeframe : Daily
Momentum indicator is back under 0
Type : Bearish
Timeframe : Daily
Williams %R indicator is back under -50
Type : Bearish
Timeframe : Daily
The Central Patterns scanner, which studies chart patterns, resistances and supports, has identified these signals:
Horizontal resistance is broken
Type : Bullish
Timeframe : Daily
Support of channel is broken
Type : Bearish
Timeframe : Daily
From the Japanese candlestick perspective, the Central Candlesticks scanner notes the presence of these results that could impact the short-term trend:
Black hanging man / hammer
Type : Neutral
Timeframe : Daily
Three black crows
Type : Bearish
Timeframe : Daily
| S3 | S2 | S1 | Price | R1 | R2 | R3 | |
|---|---|---|---|---|---|---|---|
| ProTrendLines | 119.24 | 121.25 | 123.99 | 124.42 | 126.04 | 128.35 | 133.05 |
| Change (%) | -4.16% | -2.55% | -0.35% | - | +1.30% | +3.16% | +6.94% |
| Change | -5.18 | -3.17 | -0.43 | - | +1.62 | +3.93 | +8.63 |
| Level | Major | Intermediate | Major | - | Major | Major | Minor |
Pivot points can also be used to set your price objectives. Here is the price situation in relation to pivot points:
| Pivot points | S3 | S2 | S1 | PP | R1 | R2 | R3 |
|---|---|---|---|---|---|---|---|
| Standard | 118.88 | 120.20 | 121.97 | 123.29 | 125.06 | 126.38 | 128.15 |
| Camarilla | 122.88 | 123.16 | 123.45 | 123.73 | 124.01 | 124.30 | 124.58 |
| Woodie | 119.10 | 120.31 | 122.19 | 123.40 | 125.28 | 126.49 | 128.37 |
| Fibonacci | 120.20 | 121.38 | 122.11 | 123.29 | 124.47 | 125.20 | 126.38 |
| Pivot points | S3 | S2 | S1 | PP | R1 | R2 | R3 |
|---|---|---|---|---|---|---|---|
| Standard | 116.20 | 118.86 | 121.30 | 123.96 | 126.40 | 129.06 | 131.50 |
| Camarilla | 122.33 | 122.80 | 123.26 | 123.73 | 124.20 | 124.67 | 125.13 |
| Woodie | 116.08 | 118.81 | 121.18 | 123.91 | 126.28 | 129.01 | 131.38 |
| Fibonacci | 118.86 | 120.81 | 122.02 | 123.96 | 125.91 | 127.12 | 129.06 |
| Pivot points | S3 | S2 | S1 | PP | R1 | R2 | R3 |
|---|---|---|---|---|---|---|---|
| Standard | 102.43 | 108.27 | 113.30 | 119.14 | 124.17 | 130.01 | 135.04 |
| Camarilla | 115.33 | 116.33 | 117.32 | 118.32 | 119.32 | 120.31 | 121.31 |
| Woodie | 102.02 | 108.07 | 112.89 | 118.94 | 123.76 | 129.81 | 134.63 |
| Fibonacci | 108.27 | 112.43 | 114.99 | 119.14 | 123.30 | 125.86 | 130.01 |
Numerical data
The following is the status of the technical indicators and moving averages at the time of publication of this technical analysis:
| RSI (14): | 53.85 | |
| MACD (12,26,9): | 0.9400 | |
| Directional Movement: | 6.96 | |
| AROON (14): | -57.15 | |
| DEMA (21): | 125.18 | |
| Parabolic SAR (0,02-0,02-0,2): | 127.90 | |
| Elder Ray (13): | 0.22 | |
| Super Trend (3,10): | 117.64 | |
| Zig ZAG (10): | 124.42 | |
| VORTEX (21): | 1.0300 | |
| Stochastique (14,3,5): | 43.14 | |
| TEMA (21): | 125.22 | |
| Williams %R (14): | -55.54 | |
| Chande Momentum Oscillator (20): | -0.28 | |
| Repulse (5,40,3): | -0.2300 | |
| ROCnROLL: | 1 | |
| TRIX (15,9): | 0.1400 | |
| Courbe Coppock: | 2.79 |
| MA7: | 124.46 | |
| MA20: | 123.92 | |
| MA50: | 121.37 | |
| MA100: | 121.17 | |
| MAexp7: | 124.46 | |
| MAexp20: | 123.81 | |
| MAexp50: | 122.22 | |
| MAexp100: | 121.64 | |
| Price / MA7: | -0.03% | |
| Price / MA20: | +0.40% | |
| Price / MA50: | +2.51% | |
| Price / MA100: | +2.68% | |
| Price / MAexp7: | -0.03% | |
| Price / MAexp20: | +0.49% | |
| Price / MAexp50: | +1.80% | |
| Price / MAexp100: | +2.29% |
News
Don"t forget to follow the news on SIGNATURE BANK. At the time of publication of this analysis, the latest news was as follows:
- Signature Bank Announces Offering of Subordinated Notes
- Signature Bank Reports 2019 Third Quarter Results
- Signature Bank to Host 2019 Third Quarter Results Conference Call
- Signature Bank Ranks Number One in Three Categories of New York Law Journal’s 10th Annual “Best of” Survey
- Atlantic Energy enters into a combined $25 million Capital Facility with Signature Bank and V3 Commodities
About author

Online


Add a comment
Comments
0 comments on the analysis SIGNATURE BANK - Daily