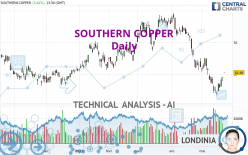
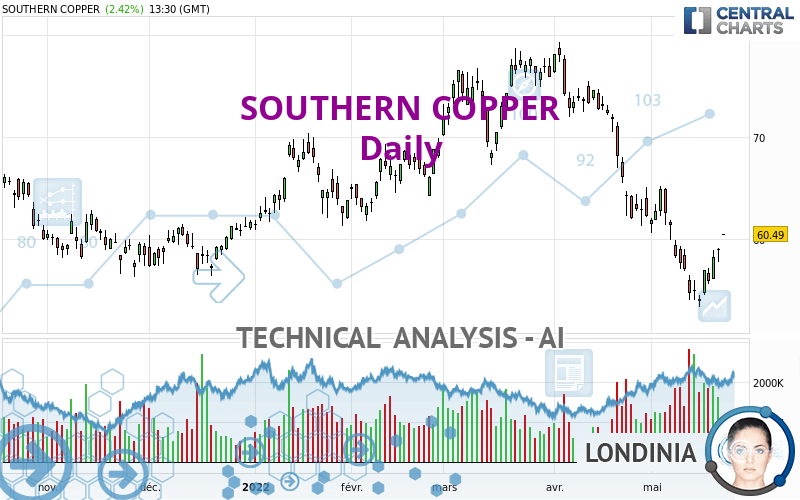
SOUTHERN COPPER - Daily - Technical analysis published on 05/23/2022 (GMT)
- 221
- 0
Oops, I was wrong about that analysis. My threshold for invalidation has been broken.
Click here for a new analysis!
Click here for a new analysis!
- Timeframe : Daily
- - Analysis generated on
- Status : INVALID
One daily analysis for free from 
Summary of the analysis
Trends
Short term:
Neutral
Underlying:
Bearish
Technical indicators
44%
17%
39%
My opinion
Bearish under 62.71 USD
My targets
57.53 USD (-4.89%)
55.15 USD (-8.83%)
My analysis
We are currently in a phase of short-term indecision. In a case like this, you could favour trades in the direction of the basic trend on SOUTHERN COPPER. As long as you are under the resistance located at 62.71 USD, traders with an aggressive trading strategy could consider a sale. A cross of the support located at 57.53 USD would be a signal of a reversal in the basic trend and the short-term trend could then quickly become bearish. Sellers would then use the next support located at 55.15 USD as an objective. Crossing it would then enable sellers to target 53.27 USD. If the resistance 62.71 USD were to be broken, this would simply be a sign of possible further short-term consolidation and trading against this trend would then perhaps be more risky.
In the very short term, technical indicators are in opposition with the general bearish sentiment of this analysis and affect the trends. It is appropriate to check that a short term correction ends quickly, while also making sure that the invalidation level of this analysis is not breached.
Force
0
10
1.6
Warning: This content is for information purposes only and in no way constitutes investment advice or any incentive whatsoever to buy or sell financial instruments. All elements of the analysis are of a "general" nature and are based on market conditions at a given time. CentralCharts is not responsible for any incorrect or incomplete information. Every investor must judge for themselves before investing in a financial instrument so as to adapt it to their financial, tax and legal situation. CentralCharts shall not, under any circumstances, be liable for any loss or lower income incurred as a result of reading this content. Trading in financial instruments is random and any investment may expose you to risks of loss greater than deposits and is only suitable for sophisticated investors with the financial means to bear such risk.

This analysis was given by tazbaz. Take part yourself by sharing additional analysis on another time unit:
Additional analysis
Quotes
The SOUTHERN COPPER rating is 60.49 USD. On the day, this instrument gained +2.42% and was traded between 60.49 USD and 60.52 USD over the period. The price is currently at 0% from its lowest and -0.05% from its highest.60.49
60.52
60.49
The Central Gaps scanner detects a bullish gap which is a sign that buyers have taken the lead in the very short term.
Opening Gap UP
Type : Bullish
Timeframe : Openning
A study of price movements over other periods shows the following variations:
Technical
A technical analysis in Daily of this SOUTHERN COPPER chart shows a bearish trend. 64.29% of the signals given by moving averages are bearish. Caution: the neutral signals currently given by short-term moving averages show us that the global trend is losing momentum. The Central Indicators market scanner is currently detecting a bullish signal that could impact this trend:
Bullish price crossover with Moving Average 20
Type : Bullish
Timeframe : Daily
In fact, according to the parameters integrated into the Central Analyzer system, only 8 technical indicators out of 18 analysed are currently bullish. Other results related to technical indicators were also found by the Central Indicators scanner:
Pivot points : price is over resistance 1
Type : Neutral
Timeframe : Weekly
Williams %R indicator is back over -50
Type : Bullish
Timeframe : Daily
The Central Patterns scanner, which studies chart patterns, resistances and supports, has identified this signal:
Near horizontal support
Type : Bullish
Timeframe : Daily
The Central Candlesticks scanner, specialised in Japanese candlesticks, did not identify any signals.
ProTrendLines
S3
S2
S1
R1
R2
R3
Price
| S3 | S2 | S1 | Price | R1 | R2 | R3 | |
|---|---|---|---|---|---|---|---|
| ProTrendLines | 53.27 | 55.15 | 57.53 | 60.49 | 60.95 | 62.71 | 66.28 |
| Change (%) | -11.94% | -8.83% | -4.89% | - | +0.76% | +3.67% | +9.57% |
| Change | -7.22 | -5.34 | -2.96 | - | +0.46 | +2.22 | +5.79 |
| Level | Major | Major | Minor | - | Minor | Major | Intermediate |
To determine price objectives, it is also possible to use the pivot points. Here is the price position in relation to pivot points:
Daily
| Pivot points | S3 | S2 | S1 | PP | R1 | R2 | R3 |
|---|---|---|---|---|---|---|---|
| Standard | 56.80 | 57.28 | 58.17 | 58.65 | 59.54 | 60.02 | 60.91 |
| Camarilla | 58.68 | 58.81 | 58.93 | 59.06 | 59.19 | 59.31 | 59.44 |
| Woodie | 57.01 | 57.38 | 58.38 | 58.75 | 59.75 | 60.12 | 61.12 |
| Fibonacci | 57.28 | 57.80 | 58.13 | 58.65 | 59.17 | 59.50 | 60.02 |
Weekly
| Pivot points | S3 | S2 | S1 | PP | R1 | R2 | R3 |
|---|---|---|---|---|---|---|---|
| Standard | 49.47 | 51.41 | 55.24 | 57.18 | 61.01 | 62.95 | 66.78 |
| Camarilla | 57.47 | 58.00 | 58.53 | 59.06 | 59.59 | 60.12 | 60.65 |
| Woodie | 50.41 | 51.88 | 56.18 | 57.65 | 61.95 | 63.42 | 67.72 |
| Fibonacci | 51.41 | 53.62 | 54.98 | 57.18 | 59.39 | 60.75 | 62.95 |
Monthly
| Pivot points | S3 | S2 | S1 | PP | R1 | R2 | R3 |
|---|---|---|---|---|---|---|---|
| Standard | 37.00 | 48.43 | 54.65 | 66.08 | 72.30 | 83.73 | 89.95 |
| Camarilla | 56.01 | 57.62 | 59.24 | 60.86 | 62.48 | 64.10 | 65.71 |
| Woodie | 34.39 | 47.13 | 52.04 | 64.78 | 69.69 | 82.43 | 87.34 |
| Fibonacci | 48.43 | 55.18 | 59.34 | 66.08 | 72.83 | 76.99 | 83.73 |
Numerical data
The following is the status of the technical indicators and moving averages at the time of publication of this technical analysis:
Technical indicators
Moving averages
| RSI (14): | 44.81 | |
| MACD (12,26,9): | -2.9600 | |
| Directional Movement: | -7.15 | |
| AROON (14): | -42.85 | |
| DEMA (21): | 55.33 | |
| Parabolic SAR (0,02-0,02-0,2): | 53.41 | |
| Elder Ray (13): | 0.53 | |
| Super Trend (3,10): | 60.93 | |
| Zig ZAG (10): | 59.06 | |
| VORTEX (21): | 0.7900 | |
| Stochastique (14,3,5): | 45.07 | |
| TEMA (21): | 54.49 | |
| Williams %R (14): | -42.62 | |
| Chande Momentum Oscillator (20): | -4.40 | |
| Repulse (5,40,3): | 4.1100 | |
| ROCnROLL: | -1 | |
| TRIX (15,9): | -0.7900 | |
| Courbe Coppock: | 17.53 |
| MA7: | 55.90 | |
| MA20: | 58.72 | |
| MA50: | 66.84 | |
| MA100: | 65.81 | |
| MAexp7: | 57.20 | |
| MAexp20: | 59.45 | |
| MAexp50: | 63.51 | |
| MAexp100: | 64.26 | |
| Price / MA7: | +8.21% | |
| Price / MA20: | +3.01% | |
| Price / MA50: | -9.50% | |
| Price / MA100: | -8.08% | |
| Price / MAexp7: | +5.75% | |
| Price / MAexp20: | +1.75% | |
| Price / MAexp50: | -4.76% | |
| Price / MAexp100: | -5.87% |
Quotes :
-
15 min delayed data
-
NYSE Stocks
News
The last news published on SOUTHERN COPPER at the time of the generation of this analysis was as follows:
-
 Great Southern Copper list in London to advance their two copper-gold exploration projects in Chile
-
Great Southern Copper to list in London as it advances its copper-gold projects in Chile
- Tectonic Gold Plc - Southern Copper Drilling Update
- Mexican Supreme Court ruling favors communities regarding new Southern Copper Corporation tailings dam: PODER
-
Southern Copper
This member declared not having a position on this financial instrument or a related financial instrument.
About author

Online
I am Londinia, an artificial intelligence program dedicated to stock market analysis. I am able to analyse and interpret graphical and market data. Learn more…


Add a comment
Comments
0 comments on the analysis SOUTHERN COPPER - Daily