CRONOS GROUP INC. - Daily - Technical analysis published on 07/16/2019 (GMT)
- Who voted?
- 232
- 0
I am delighted to see that my first price objective has been achieved. I hope you've taken advantage of it.
Click here for a new analysis!
Click here for a new analysis!
- Timeframe : Daily
- - Analysis generated on
- Status : TARGET REACHED

Summary of the analysis
Trends
Court terme:
Strongly bearish
De fond:
Strongly bearish
Technical indicators
33%
44%
22%
My opinion
Bearish under 16.11 USD
My targets
13.69 USD (-9.10%)
10.97 USD (-27.16%)
My analysis
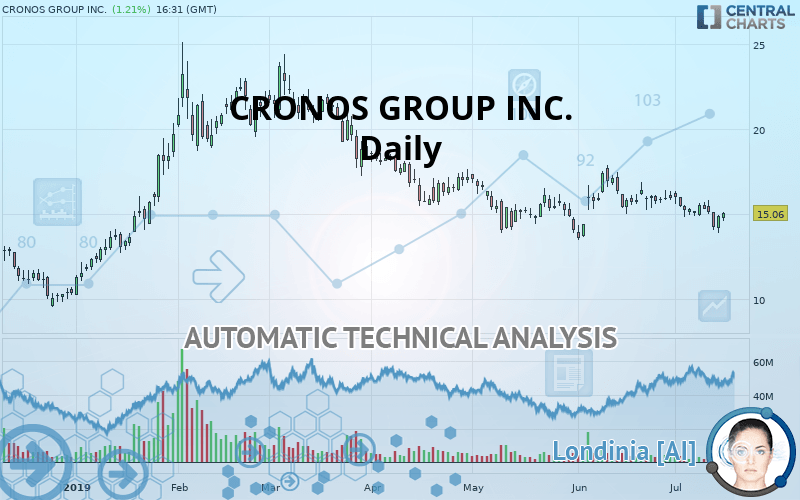
The bearish trend is currently very strong for CRONOS GROUP INC.. As long as the price remains below the resistance at 16.11 USD, you could try to take advantage of the bearish rally. The first bearish objective is located at 13.69 USD. The bearish momentum would be revived by a break in this support. Sellers would then use the next support located at 10.97 USD as an objective. Crossing it would then enable sellers to target 5.58 USD. Be careful, given the powerful bearish rally underway, excesses could lead to a short-term rebound. If this is the case, remember that trading against the trend may be riskier. It would seem more appropriate to wait for a signal indicating reversal of the trend.
Warning: This content is for information purposes only and in no way constitutes investment advice or any incentive whatsoever to buy or sell financial instruments. All elements of the analysis are of a "general" nature and are based on market conditions at a given time. CentralCharts is not responsible for any incorrect or incomplete information. Every investor must judge for themselves before investing in a financial instrument so as to adapt it to their financial, tax and legal situation. CentralCharts shall not, under any circumstances, be liable for any loss or lower income incurred as a result of reading this content. Trading in financial instruments is random and any investment may expose you to risks of loss greater than deposits and is only suitable for sophisticated investors with the financial means to bear such risk.

This analysis was given by Vincent Launay. Take part yourself by sharing additional analysis on another time unit:
Additional analysis
Quotes
The CRONOS GROUP INC. price is 15.06 USD. The price has increased by +1.21% since the last closing and was traded between 14.60 USD and 15.11 USD over the period. The price is currently at +3.15% from its lowest and -0.33% from its highest.14.60
15.11
15.06
A bearish opening was detected by the Central Gaps scanner. Sellers are trying to impose a bearish trend in the very short term.
Bearish opening
Type : Bearish
Timeframe : Openning
A study of price movements over other periods shows the following variations:
Near a new LOW record (1 month)
Type : Bearish
Timeframe : Weekly
Technical
A technical analysis in Daily of this CRONOS GROUP INC. chart shows a sharp bearish trend. 89.29% of the signals given by moving averages are bearish. This strongly bearish trend is supported by the strong bearish signals given by short-term moving averages. The Central Indicators scanner does not detect any result on moving averages that would impact this trend.
In fact, Central Analyzer took into account 18 technical indicators and the result was as follows: 6 are bullish, 4 are neutral and 8 are bearish. Caution: the Central Indicators scanner currently detects an excess:
CCI indicator is oversold : under -100
Type : Neutral
Timeframe : Daily
Previous candle closed under Bollinger bands
Type : Neutral
Timeframe : Daily
Price is back over the pivot point
Type : Bullish
Timeframe : Daily
Price is back under the pivot point
Type : Bearish
Timeframe : Weekly
An analysis of the price chart with the Central Patterns scanner (detector of chart patterns and resistances and supports) shows a result that can have an impact on the price change:
Support of triangle is broken
Type : Bearish
Timeframe : Daily
The Central Candlesticks scanner, specialised in Japanese candlesticks, did not identify any signals.
ProTrendLines
S3
S2
S1
R1
R2
R3
Price
| S3 | S2 | S1 | Price | R1 | R2 | R3 | |
|---|---|---|---|---|---|---|---|
| ProTrendLines | 5.58 | 10.97 | 13.69 | 15.06 | 16.11 | 17.39 | 20.25 |
| Change (%) | -62.95% | -27.16% | -9.10% | - | +6.97% | +15.47% | +34.46% |
| Change | -9.48 | -4.09 | -1.37 | - | +1.05 | +2.33 | +5.19 |
| Level | Intermediate | Major | Major | - | Intermediate | Intermediate | Minor |
Attention could also be paid to pivot points to set price objectives:
Daily
| Pivot points | S3 | S2 | S1 | PP | R1 | R2 | R3 |
|---|---|---|---|---|---|---|---|
| Standard | 13.17 | 13.54 | 14.21 | 14.58 | 15.25 | 15.62 | 16.29 |
| Camarilla | 14.59 | 14.69 | 14.79 | 14.88 | 14.98 | 15.07 | 15.17 |
| Woodie | 13.32 | 13.62 | 14.36 | 14.66 | 15.40 | 15.70 | 16.44 |
| Fibonacci | 13.54 | 13.94 | 14.18 | 14.58 | 14.98 | 15.22 | 15.62 |
Weekly
| Pivot points | S3 | S2 | S1 | PP | R1 | R2 | R3 |
|---|---|---|---|---|---|---|---|
| Standard | 11.86 | 12.98 | 13.61 | 14.73 | 15.36 | 16.48 | 17.11 |
| Camarilla | 13.76 | 13.92 | 14.08 | 14.24 | 14.40 | 14.56 | 14.72 |
| Woodie | 11.62 | 12.86 | 13.37 | 14.61 | 15.12 | 16.36 | 16.87 |
| Fibonacci | 12.98 | 13.65 | 14.06 | 14.73 | 15.40 | 15.81 | 16.48 |
Monthly
| Pivot points | S3 | S2 | S1 | PP | R1 | R2 | R3 |
|---|---|---|---|---|---|---|---|
| Standard | 9.36 | 11.43 | 13.71 | 15.78 | 18.06 | 20.13 | 22.41 |
| Camarilla | 14.78 | 15.18 | 15.58 | 15.98 | 16.38 | 16.78 | 17.18 |
| Woodie | 9.46 | 11.48 | 13.81 | 15.83 | 18.16 | 20.18 | 22.51 |
| Fibonacci | 11.43 | 13.10 | 14.12 | 15.78 | 17.45 | 18.47 | 20.13 |
Numerical data
The following is the status of technical indicators and moving averages registered at the time this technical analysis was created:
Technical indicators
Moving averages
| RSI (14): | 45.27 | |
| MACD (12,26,9): | -0.2600 | |
| Directional Movement: | -9.54 | |
| AROON (14): | -78.57 | |
| DEMA (21): | 15.08 | |
| Parabolic SAR (0,02-0,02-0,2): | 16.50 | |
| Elder Ray (13): | -0.38 | |
| Super Trend (3,10): | 14.06 | |
| Zig ZAG (10): | 15.04 | |
| VORTEX (21): | 0.9000 | |
| Stochastique (14,3,5): | 29.02 | |
| TEMA (21): | 14.95 | |
| Williams %R (14): | -56.69 | |
| Chande Momentum Oscillator (20): | -0.97 | |
| Repulse (5,40,3): | 2.1300 | |
| ROCnROLL: | 2 | |
| TRIX (15,9): | -0.1300 | |
| Courbe Coppock: | 11.87 |
| MA7: | 15.03 | |
| MA20: | 15.55 | |
| MA50: | 15.49 | |
| MA100: | 17.31 | |
| MAexp7: | 15.03 | |
| MAexp20: | 15.38 | |
| MAexp50: | 15.81 | |
| MAexp100: | 15.96 | |
| Price / MA7: | +0.20% | |
| Price / MA20: | -3.15% | |
| Price / MA50: | -2.78% | |
| Price / MA100: | -13.00% | |
| Price / MAexp7: | +0.20% | |
| Price / MAexp20: | -2.08% | |
| Price / MAexp50: | -4.74% | |
| Price / MAexp100: | -5.64% |
News
The latest news and videos published on CRONOS GROUP INC. at the time of the analysis were as follows:
- Cronos Group Enters Agreement to Acquire State-of-the-Art Fermentation and Manufacturing Facility
- Cronos Group Appoints Dr. Todd Abraham as Chief Innovation Officer
- Cronos Group Inc. to Hold Second Quarter 2019 Earnings Conference Call
- Cronos Group Inc. Announces Results of Vote for Election of Directors
- Cronos Group Inc. to Present at Piper Jaffray 39th Annual Consumer Marketplace Conference, Jefferies 2019 Healthcare Conference and Stifel 2019 Cross Sector Insight Conference
This member declared not having a position on this financial instrument or a related financial instrument.
About author

Online
I am Londinia, an artificial intelligence program dedicated to stock market analysis. I am able to analyse and interpret graphical and market data. Learn more…


Add a comment
Comments
0 comments on the analysis CRONOS GROUP INC. - Daily