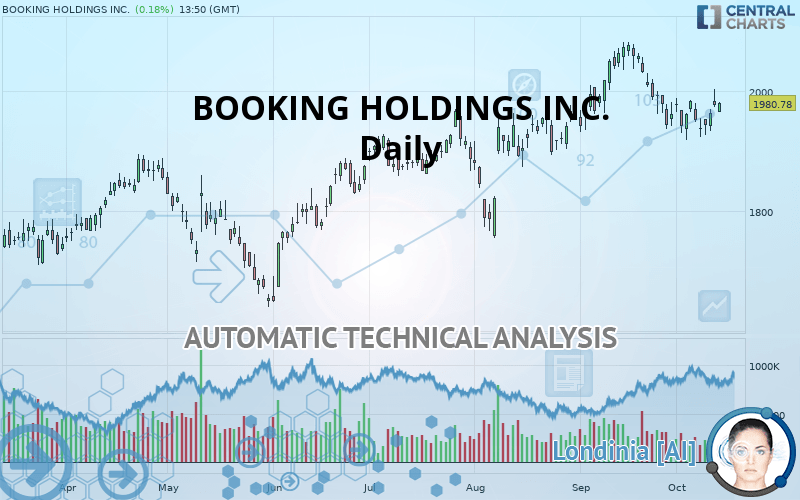
BOOKING HOLDINGS INC. - Daily - Technical analysis published on 10/14/2019 (GMT)
- Who voted?
- 374
- 0
Click here for a new analysis!
- Timeframe : Daily
- - Analysis generated on
- Status : TARGET REACHED

Summary of the analysis

Additional analysis
Quotes
The BOOKING HOLDINGS INC. rating is 1,980.78 USD. The price registered an increase of +0.18% on the session and was traded between 1,964.52 USD and 1,981.56 USD over the period. The price is currently at +0.83% from its lowest and -0.04% from its highest.A bearish gap was detected at the opening by the Central Gaps scanner. There are a lot of sellers and they have the upper hand in the very short term.
Opening Gap DOWN
Type : Bearish
Timeframe : Openning
Here is a more detailed summary of the historical variations registered by BOOKING HOLDINGS INC.:
Near a new HIGH record (1 year)
Type : Bullish
Timeframe : Weekly
Near a new HIGH record (1st january)
Type : Bullish
Timeframe : Weekly
Near a new LOW record (1 month)
Type : Bearish
Timeframe : Weekly
Technical
Technical analysis of this Daily chart of BOOKING HOLDINGS INC. indicates that the overall trend is strongly bullish. 82.14% of the signals given by moving averages are bullish. The slightly bullish signals given by the short-term moving averages show a weakening of the global trend. The Central Indicators market scanner is currently detecting several bullish signals that could impact this trend:
Bullish trend reversal : adaptative moving average 50
Type : Bullish
Timeframe : Daily
Bullish price crossover with adaptative moving average 20
Type : Bullish
Timeframe : Daily
An assessment of technical indicators does not currently provide any relevant information on the direction of future price movements.
Caution: the Central Indicators scanner currently detects an excess:
Williams %R indicator is overbought : over -20
Type : Neutral
Timeframe : Daily
RSI indicator is back over 50
Type : Bullish
Timeframe : Daily
Parabolic SAR indicator bullish reversal
Type : Bullish
Timeframe : Daily
Price is back over the pivot point
Type : Bullish
Timeframe : Daily
Price is back over the pivot point
Type : Bullish
Timeframe : Weekly
Williams %R indicator is back over -50
Type : Bullish
Timeframe : Daily
The analysis of the price chart with Central Patterns scanners does not return any result.
Central Candlesticks, the scanner specialised in Japanese candlesticks, detects a bullish signal that could support the hypothesis of a small rebound in the very short term:
Bullish engulfing lines
Type : Bullish
Timeframe : Daily
| S3 | S2 | S1 | Price | R1 | R2 | R3 | |
|---|---|---|---|---|---|---|---|
| ProTrendLines | 1,789.29 | 1,888.19 | 1,937.81 | 1,980.78 | 1,983.20 | 2,049.00 | 2,206.09 |
| Change (%) | -9.67% | -4.67% | -2.17% | - | +0.12% | +3.44% | +11.37% |
| Change | -191.49 | -92.59 | -42.97 | - | +2.42 | +68.22 | +225.31 |
| Level | Major | Minor | Major | - | Intermediate | Major | Major |
Pivot points can also be used to set your price objectives. Here is the price situation in relation to pivot points:
| Pivot points | S3 | S2 | S1 | PP | R1 | R2 | R3 |
|---|---|---|---|---|---|---|---|
| Standard | 1,904.43 | 1,919.14 | 1,941.02 | 1,955.73 | 1,996.33 | 2,015.49 | 2,027.18 |
| Camarilla | 1,952.85 | 1,956.20 | 1,959.56 | 1,962.91 | 1,966.26 | 1,969.62 | 1,972.97 |
| Woodie | 1,930.91 | 1,920.93 | 1,944.62 | 1,957.52 | 1,981.21 | 1,994.11 | 2,017.80 |
| Fibonacci | 1,953.79 | 1,965.57 | 1,972.85 | 1,984.64 | 1,996.42 | 2,003.70 | 2,015.49 |
| Pivot points | S3 | S2 | S1 | PP | R1 | R2 | R3 |
|---|---|---|---|---|---|---|---|
| Standard | 1,868.84 | 1,893.53 | 1,938.37 | 1,963.06 | 2,012.79 | 2,048.41 | 2,093.02 |
| Camarilla | 1,964.08 | 1,970.45 | 1,976.83 | 1,983.20 | 1,989.57 | 1,995.95 | 2,002.32 |
| Woodie | 1,856.84 | 1,898.57 | 1,948.44 | 1,968.10 | 2,017.97 | 2,037.63 | 2,087.50 |
| Fibonacci | 1,887.95 | 1,918.60 | 1,937.53 | 1,968.18 | 1,998.83 | 2,017.76 | 2,048.41 |
| Pivot points | S3 | S2 | S1 | PP | R1 | R2 | R3 |
|---|---|---|---|---|---|---|---|
| Standard | 1,751.69 | 1,841.56 | 1,902.08 | 1,991.95 | 2,052.47 | 2,142.34 | 2,202.86 |
| Camarilla | 1,921.25 | 1,935.04 | 1,948.82 | 1,962.61 | 1,976.40 | 1,990.18 | 2,003.97 |
| Woodie | 1,737.03 | 1,834.22 | 1,887.42 | 1,984.61 | 2,037.81 | 2,135.00 | 2,188.20 |
| Fibonacci | 1,841.56 | 1,899.01 | 1,934.50 | 1,991.95 | 2,049.40 | 2,084.89 | 2,142.34 |
Numerical data
The following is the status of the technical indicators and moving averages at the time of publication of this technical analysis:
| RSI (14): | 50.77 | |
| MACD (12,26,9): | -5.7200 | |
| Directional Movement: | -3.21 | |
| AROON (14): | -57.14 | |
| DEMA (21): | 1,970.54 | |
| Parabolic SAR (0,02-0,02-0,2): | 1,918.23 | |
| Elder Ray (13): | 19.38 | |
| Super Trend (3,10): | 2,043.39 | |
| Zig ZAG (10): | 1,971.27 | |
| VORTEX (21): | 0.8400 | |
| Stochastique (14,3,5): | 53.11 | |
| TEMA (21): | 1,952.67 | |
| Williams %R (14): | -34.98 | |
| Chande Momentum Oscillator (20): | -4.59 | |
| Repulse (5,40,3): | 0.3900 | |
| ROCnROLL: | 1 | |
| TRIX (15,9): | -0.0100 | |
| Courbe Coppock: | 5.49 |
| MA7: | 1,961.12 | |
| MA20: | 1,986.15 | |
| MA50: | 1,960.88 | |
| MA100: | 1,897.67 | |
| MAexp7: | 1,964.85 | |
| MAexp20: | 1,973.65 | |
| MAexp50: | 1,957.42 | |
| MAexp100: | 1,918.41 | |
| Price / MA7: | +1.00% | |
| Price / MA20: | -0.27% | |
| Price / MA50: | +1.01% | |
| Price / MA100: | +4.38% | |
| Price / MAexp7: | +0.81% | |
| Price / MAexp20: | +0.36% | |
| Price / MAexp50: | +1.19% | |
| Price / MAexp100: | +3.25% |
About author

Online


Add a comment
Comments
0 comments on the analysis BOOKING HOLDINGS INC. - Daily