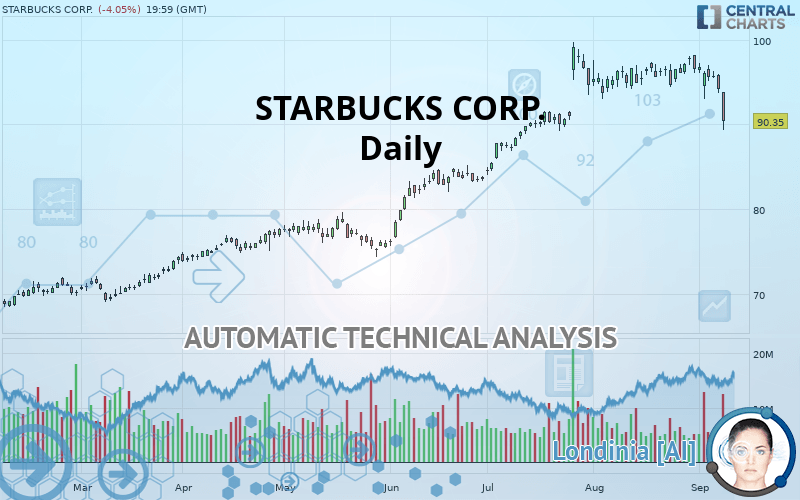
STARBUCKS CORP. - Daily - Technical analysis published on 09/10/2019 (GMT)
- Who voted?
- 260
- 0
Click here for a new analysis!
- Timeframe : Daily
- - Analysis generated on
- Status : TARGET REACHED

Summary of the analysis

Additional analysis
Quotes
The STARBUCKS CORP. rating is 90.35 USD. On the day, this instrument lost -4.05% and was traded between 89.30 USD and 93.88 USD over the period. The price is currently at +1.18% from its lowest and -3.76% from its highest.The Central Gaps scanner detects a bullish opening marking the presence of sellers ahead of buyers at the opening but not sufficiently marked to allow the price to register a quotation gap.
Bearish opening
Type : Bearish
Timeframe : Openning
So that you have an overall view of the price change, here is a table showing the variations over several periods:
Near a new HIGH record (5 years)
Type : Bullish
Timeframe : Weekly
Near a new HIGH record (1 month)
Type : Bullish
Timeframe : Weekly
Technical
A technical analysis in Daily of this STARBUCKS CORP. chart shows a slightly bullish trend. 57.14% of the signals given by moving averages are bullish. Caution: a reversal of the trend could be possible given the strong bearish signals of short-term moving averages. The Central Indicators market scanner is currently detecting several bearish signals that could impact this trend:
Bearish price crossover with adaptative moving average 20
Type : Bearish
Timeframe : Daily
Bearish price crossover with adaptative moving average 50
Type : Bearish
Timeframe : Daily
Bearish price crossover with adaptative moving average 100
Type : Bearish
Timeframe : Daily
In fact, 13 technical indicators on 18 studied are currently positioned bearish. Caution: the Central Indicators scanner currently detects an excess:
CCI indicator is oversold : under -100
Type : Neutral
Timeframe : Daily
Pivot points : price is under support 3
Type : Neutral
Timeframe : Daily
Pivot points : price is under support 3
Type : Neutral
Timeframe : Weekly
RSI indicator is back under 50
Type : Bearish
Timeframe : Daily
Momentum indicator is back under 0
Type : Bearish
Timeframe : Daily
Williams %R indicator is back under -50
Type : Bearish
Timeframe : Daily
The Central Patterns scanner, which studies chart patterns, resistances and supports, has identified these signals:
Horizontal support is broken
Type : Bearish
Timeframe : Daily
Support of channel is broken
Type : Bearish
Timeframe : Daily
No result was found by the Central Candlesticks scanner on Japanese candlesticks.
| S3 | S2 | S1 | Price | R1 | R2 | |
|---|---|---|---|---|---|---|
| ProTrendLines | 68.72 | 75.28 | 87.51 | 90.35 | 94.74 | 99.11 |
| Change (%) | -23.94% | -16.68% | -3.14% | - | +4.86% | +9.70% |
| Change | -21.63 | -15.07 | -2.84 | - | +4.39 | +8.76 |
| Level | Minor | Intermediate | Minor | - | Intermediate | Major |
Attention could also be paid to pivot points to set price objectives:
| Pivot points | S3 | S2 | S1 | PP | R1 | R2 | R3 |
|---|---|---|---|---|---|---|---|
| Standard | 91.10 | 92.42 | 93.29 | 94.61 | 95.48 | 96.80 | 97.67 |
| Camarilla | 93.56 | 93.76 | 93.96 | 94.16 | 94.36 | 94.56 | 94.76 |
| Woodie | 90.88 | 92.31 | 93.07 | 94.50 | 95.26 | 96.69 | 97.45 |
| Fibonacci | 92.42 | 93.26 | 93.77 | 94.61 | 95.45 | 95.96 | 96.80 |
| Pivot points | S3 | S2 | S1 | PP | R1 | R2 | R3 |
|---|---|---|---|---|---|---|---|
| Standard | 89.27 | 91.15 | 93.45 | 95.33 | 97.62 | 99.51 | 101.80 |
| Camarilla | 94.59 | 94.97 | 95.36 | 95.74 | 96.12 | 96.51 | 96.89 |
| Woodie | 89.47 | 91.25 | 93.65 | 95.43 | 97.83 | 99.61 | 102.01 |
| Fibonacci | 91.15 | 92.75 | 93.73 | 95.33 | 96.92 | 97.91 | 99.51 |
| Pivot points | S3 | S2 | S1 | PP | R1 | R2 | R3 |
|---|---|---|---|---|---|---|---|
| Standard | 88.57 | 90.80 | 93.68 | 95.91 | 98.79 | 101.02 | 103.90 |
| Camarilla | 95.16 | 95.62 | 96.09 | 96.56 | 97.03 | 97.50 | 97.97 |
| Woodie | 88.90 | 90.96 | 94.01 | 96.07 | 99.12 | 101.18 | 104.23 |
| Fibonacci | 90.80 | 92.75 | 93.96 | 95.91 | 97.86 | 99.07 | 101.02 |
Numerical data
The following is the status of the technical indicators and moving averages at the time of publication of this technical analysis:
| RSI (14): | 34.59 | |
| MACD (12,26,9): | 0.1400 | |
| Directional Movement: | -25.95 | |
| AROON (14): | -42.86 | |
| DEMA (21): | 95.75 | |
| Parabolic SAR (0,02-0,02-0,2): | 98.12 | |
| Elder Ray (13): | -3.47 | |
| Super Trend (3,10): | 97.79 | |
| Zig ZAG (10): | 90.35 | |
| VORTEX (21): | 0.8000 | |
| Stochastique (14,3,5): | 28.98 | |
| TEMA (21): | 94.28 | |
| Williams %R (14): | -88.16 | |
| Chande Momentum Oscillator (20): | -6.14 | |
| Repulse (5,40,3): | -5.8000 | |
| ROCnROLL: | 2 | |
| TRIX (15,9): | 0.1300 | |
| Courbe Coppock: | 2.23 |
| MA7: | 95.04 | |
| MA20: | 95.80 | |
| MA50: | 93.39 | |
| MA100: | 86.33 | |
| MAexp7: | 94.32 | |
| MAexp20: | 95.13 | |
| MAexp50: | 92.61 | |
| MAexp100: | 87.43 | |
| Price / MA7: | -4.93% | |
| Price / MA20: | -5.69% | |
| Price / MA50: | -3.26% | |
| Price / MA100: | +4.66% | |
| Price / MAexp7: | -4.21% | |
| Price / MAexp20: | -5.02% | |
| Price / MAexp50: | -2.44% | |
| Price / MAexp100: | +3.34% |
News
Don"t forget to follow the news on STARBUCKS CORP.. At the time of publication of this analysis, the latest news was as follows:
-
 Why Dunkin' Is Taking On Starbucks And Betting On Coffee
-
Former Starbucks CEO Howard Schultz will not run for president in 2020
-
Starbucks Stock Drops Over Expected Profit Growth Slowing
-
Starbucks To Launch New Pumpkin Spice Drink
-
Starbucks To Sell Spooky Halloween Tumbler
About author

Online


Add a comment
Comments
0 comments on the analysis STARBUCKS CORP. - Daily