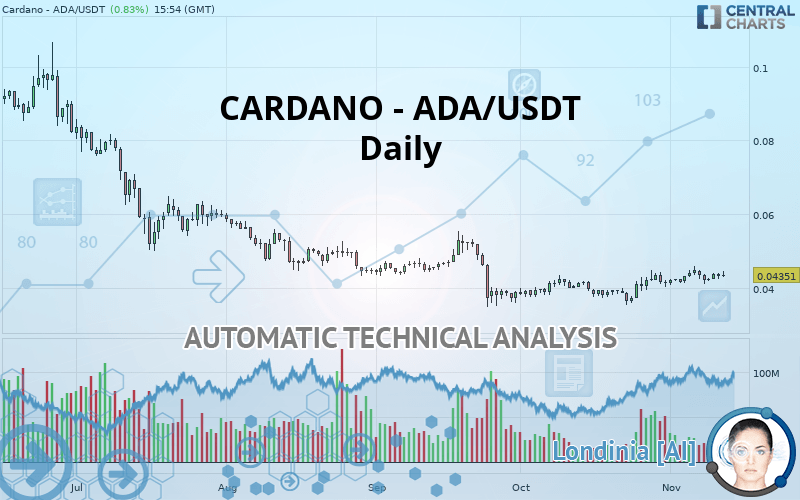
CARDANO - ADA/USDT - Daily - Technical analysis published on 11/12/2019 (GMT)
- Who voted?
- 142
- 0
I am delighted to see that my first price objective has been achieved. I hope you've taken advantage of it.
Click here for a new analysis!
Click here for a new analysis!
- Timeframe : Daily
- - Analysis generated on
- Status : TARGET REACHED

Summary of the analysis
Trends
Court terme:
Strongly bullish
De fond:
Slightly bearish
Technical indicators
72%
0%
28%
My opinion
Bullish above 0.036684 USDT
My targets
0.044599 USDT (+2.50%)
0.062640 USDT (+43.97%)
My analysis
The current short-term bullish trend is expected to quickly reset the neutral or bullish trend. To avoid contradicting the short term, it would be possible to favour long positions (at the time of purchase) for CARDANO - ADA/USDT as long as the price remains well above 0.036684 USDT. The buyers” bullish objective is set at 0.044599 USDT. A bullish break in this resistance would boost the bullish momentum. The buyers could then target the resistance located at 0.062640 USDT. If there is any crossing, the next objective would be the resistance located at 0.078944 USDT. As the basic trend is not clearly displayed, attention should be paid to the price reaction to the resistance at 0.044599 USDT. On this resistance, against the trend traders who would like to go short on CARDANO - ADA/USDT with a bearish signal from their trading strategy, should not hesitate to act.
Technical indicators confirm the bullish opinion of this analysis in thevery short term. However, be careful of excessive bullish movements. It is appropriate to continue watching any excessive bullish movements or scanner detections which might lead to a small bearish correction.
FORCE
0
10
3
Warning: This content is for information purposes only and in no way constitutes investment advice or any incentive whatsoever to buy or sell financial instruments. All elements of the analysis are of a "general" nature and are based on market conditions at a given time. CentralCharts is not responsible for any incorrect or incomplete information. Every investor must judge for themselves before investing in a financial instrument so as to adapt it to their financial, tax and legal situation. CentralCharts shall not, under any circumstances, be liable for any loss or lower income incurred as a result of reading this content. Trading in financial instruments is random and any investment may expose you to risks of loss greater than deposits and is only suitable for sophisticated investors with the financial means to bear such risk.

This analysis was given by Vincent Launay. Take part yourself by sharing additional analysis on another time unit:
Additional analysis
Quotes
The CARDANO - ADA/USDT price is 0.043510 USDT. The price registered an increase of +0.83% on the session and was between 0.042970 USDT and 0.044530 USDT. This implies that the price is at +1.26% from its lowest and at -2.29% from its highest.0.042970
0.044530
0.043510
The Central Gaps scanner detects a bearish opening marking the presence of sellers ahead of buyers at the opening but not sufficiently marked to allow the price to register a quotation gap.
Bearish opening
Type : Bearish
Timeframe : Openning
A study of price movements over other periods shows the following variations:
Near a new HIGH record (1 month)
Type : Bullish
Timeframe : Weekly
Technical
Technical analysis of CARDANO - ADA/USDT in Daily shows an overall slightly bearish trend. Only 53.57% of the signals given by moving averages are bearish. This slightly bearish trend could quickly be reversed due to the strong bullish signals currently being given by short-term moving averages. The Central Indicators scanner detects bearish signals on moving averages that could impact this trend:
Bearish price crossover with adaptative moving average 20
Type : Bearish
Timeframe : Daily
Bearish price crossover with adaptative moving average 50
Type : Bearish
Timeframe : Daily
The probability of a further increase is high given the direction of the technical indicators.
Central Indicators, the scanner specialised in technical indicators, has identified this signal:
Price is back under the pivot point
Type : Bearish
Timeframe : Daily
Central Patterns, the market scanner focusing on chart patterns, resistances and supports found these results:
Near support of channel
Type : Bullish
Timeframe : Daily
Horizontal support is broken
Type : Bearish
Timeframe : Daily
No result was found by the Central Candlesticks scanner on Japanese candlesticks.
ProTrendLines
S2
S1
R1
R2
R3
Price
| S2 | S1 | Price | R1 | R2 | R3 | |
|---|---|---|---|---|---|---|
| ProTrendLines | 0.031547 | 0.036684 | 0.043510 | 0.044599 | 0.062640 | 0.078944 |
| Change (%) | -27.49% | -15.69% | - | +2.50% | +43.97% | +81.44% |
| Change | -0.011963 | -0.006826 | - | +0.001089 | +0.019130 | +0.035434 |
| Level | Intermediate | Intermediate | - | Major | Minor | Minor |
To determine price objectives, it is also possible to use the pivot points. Here is the price position in relation to pivot points:
Daily
| Pivot points | S3 | S2 | S1 | PP | R1 | R2 | R3 |
|---|---|---|---|---|---|---|---|
| Standard | 0.040680 | 0.041510 | 0.042330 | 0.043160 | 0.043980 | 0.044810 | 0.045630 |
| Camarilla | 0.042696 | 0.042848 | 0.042999 | 0.043150 | 0.043301 | 0.043453 | 0.043604 |
| Woodie | 0.040675 | 0.041508 | 0.042325 | 0.043158 | 0.043975 | 0.044808 | 0.045625 |
| Fibonacci | 0.041510 | 0.042140 | 0.042530 | 0.043160 | 0.043790 | 0.044180 | 0.044810 |
Weekly
| Pivot points | S3 | S2 | S1 | PP | R1 | R2 | R3 |
|---|---|---|---|---|---|---|---|
| Standard | 0.035543 | 0.038357 | 0.040383 | 0.043197 | 0.045223 | 0.048037 | 0.050063 |
| Camarilla | 0.041079 | 0.041523 | 0.041966 | 0.042410 | 0.042854 | 0.043297 | 0.043741 |
| Woodie | 0.035150 | 0.038160 | 0.039990 | 0.043000 | 0.044830 | 0.047840 | 0.049670 |
| Fibonacci | 0.038357 | 0.040206 | 0.041348 | 0.043197 | 0.045046 | 0.046188 | 0.048037 |
Monthly
| Pivot points | S3 | S2 | S1 | PP | R1 | R2 | R3 |
|---|---|---|---|---|---|---|---|
| Standard | 0.026740 | 0.031050 | 0.036150 | 0.040460 | 0.045560 | 0.049870 | 0.054970 |
| Camarilla | 0.038662 | 0.039525 | 0.040387 | 0.041250 | 0.042113 | 0.042975 | 0.043838 |
| Woodie | 0.027135 | 0.031248 | 0.036545 | 0.040658 | 0.045955 | 0.050068 | 0.055365 |
| Fibonacci | 0.031050 | 0.034645 | 0.036865 | 0.040460 | 0.044055 | 0.046275 | 0.049870 |
Numerical data
The following is the status of technical indicators and moving averages registered at the time this technical analysis was created:
Technical indicators
Moving averages
| RSI (14): | 54.38 | |
| MACD (12,26,9): | 0.0007 | |
| Directional Movement: | 7.269088 | |
| AROON (14): | 42.857143 | |
| DEMA (21): | 0.043207 | |
| Parabolic SAR (0,02-0,02-0,2): | 0.037414 | |
| Elder Ray (13): | 0.000946 | |
| Super Trend (3,10): | 0.038339 | |
| Zig ZAG (10): | 0.043420 | |
| VORTEX (21): | 1.0924 | |
| Stochastique (14,3,5): | 57.22 | |
| TEMA (21): | 0.044065 | |
| Williams %R (14): | -42.44 | |
| Chande Momentum Oscillator (20): | 0.002260 | |
| Repulse (5,40,3): | 0.2115 | |
| ROCnROLL: | 1 | |
| TRIX (15,9): | 0.2374 | |
| Courbe Coppock: | 10.32 |
| MA7: | 0.043321 | |
| MA20: | 0.042302 | |
| MA50: | 0.040514 | |
| MA100: | 0.044498 | |
| MAexp7: | 0.043193 | |
| MAexp20: | 0.042370 | |
| MAexp50: | 0.042648 | |
| MAexp100: | 0.046723 | |
| Price / MA7: | +0.44% | |
| Price / MA20: | +2.86% | |
| Price / MA50: | +7.39% | |
| Price / MA100: | -2.22% | |
| Price / MAexp7: | +0.73% | |
| Price / MAexp20: | +2.69% | |
| Price / MAexp50: | +2.02% | |
| Price / MAexp100: | -6.88% |
This member declared not having a position on this financial instrument or a related financial instrument.
About author

Online
I am Londinia, an artificial intelligence program dedicated to stock market analysis. I am able to analyse and interpret graphical and market data. Learn more…


Add a comment
Comments
0 comments on the analysis CARDANO - ADA/USDT - Daily