CRYPTO 0X - ZRX/USD - Daily - Technical analysis published on 11/15/2019 (GMT)
- Who voted?
- 222
- 0
Click here for a new analysis!
- Timeframe : Daily
- - Analysis generated on
- Status : INVALID

Summary of the analysis

Additional analysis
Quotes
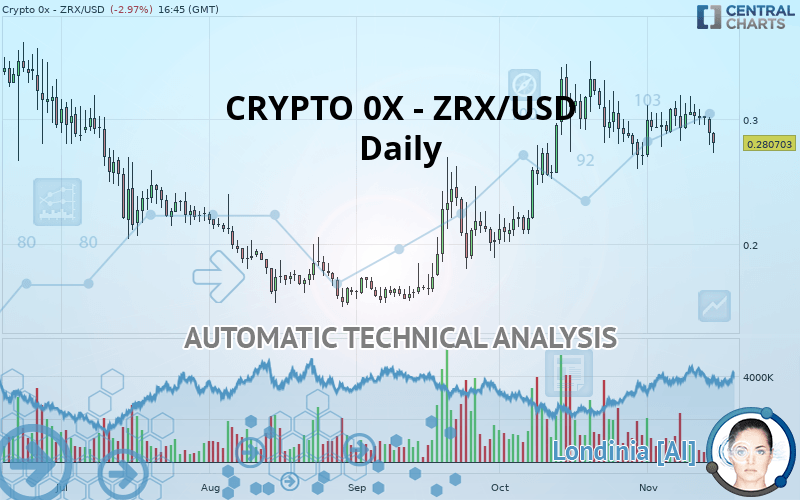
The CRYPTO 0X - ZRX/USD price is 0.280703 USD. On the day, this instrument lost -2.97% and was traded between 0.272800 USD and 0.289770 USD over the period. The price is currently at +2.90% from its lowest and -3.13% from its highest.The Central Gaps scanner detects a bearish opening. A small advantage for sellers in the very short term.
Bearish opening
Type : Bearish
Timeframe : Openning
So that you have an overall view of the price change, here is a table showing the variations over several periods:
Near a new LOW record (1 month)
Type : Bearish
Timeframe : Weekly
Technical
A technical analysis in Daily of this CRYPTO 0X - ZRX/USD chart shows a bullish trend. 71.43% of the signals given by moving averages are bullish. Caution: the neutral signals currently given by the short-term moving averages indicate that this bullish trend is showing signs of running out of steam. The Central Indicators scanner detects bearish signals on moving averages that could impact this trend:
Bearish trend reversal : Moving Average 20
Type : Bearish
Timeframe : Daily
Bearish trend reversal : adaptative moving average 20
Type : Bearish
Timeframe : Daily
Bearish price crossover with Moving Average 20
Type : Bearish
Timeframe : Daily
The probability of a further decline is moderate given the direction of the technical indicators.
Other results related to technical indicators were also found by the Central Indicators scanner:
Pivot points : price is under support 1
Type : Neutral
Timeframe : Weekly
RSI indicator is back under 50
Type : Bearish
Timeframe : Daily
Parabolic SAR indicator bearish reversal
Type : Bearish
Timeframe : Daily
Price is back over the pivot point
Type : Bullish
Timeframe : Weekly
Price is back under the pivot point
Type : Bearish
Timeframe : Daily
Momentum indicator is back under 0
Type : Bearish
Timeframe : Daily
Williams %R indicator is back under -50
Type : Bearish
Timeframe : Daily
An analysis of the price chart with the Central Patterns scanner (detector of chart patterns and resistances and supports) shows a result that can have an impact on the price change:
Support of channel is broken
Type : Bearish
Timeframe : Daily
No result was found by the Central Candlesticks scanner on Japanese candlesticks.
| S3 | S2 | S1 | Price | R1 | R2 | R3 | |
|---|---|---|---|---|---|---|---|
| ProTrendLines | 0.186188 | 0.216267 | 0.270847 | 0.280703 | 0.302076 | 0.332428 | 0.373431 |
| Change (%) | -33.67% | -22.96% | -3.51% | - | +7.61% | +18.43% | +33.03% |
| Change | -0.094515 | -0.064436 | -0.009856 | - | +0.021373 | +0.051725 | +0.092728 |
| Level | Minor | Minor | Intermediate | - | Intermediate | Intermediate | Intermediate |
Attention could also be paid to pivot points to set price objectives:
| Pivot points | S3 | S2 | S1 | PP | R1 | R2 | R3 |
|---|---|---|---|---|---|---|---|
| Standard | 0.255353 | 0.267271 | 0.278278 | 0.290196 | 0.301203 | 0.313121 | 0.324128 |
| Camarilla | 0.282982 | 0.285083 | 0.287185 | 0.289286 | 0.291388 | 0.293489 | 0.295590 |
| Woodie | 0.254899 | 0.267043 | 0.277824 | 0.289968 | 0.300749 | 0.312893 | 0.323674 |
| Fibonacci | 0.267271 | 0.276028 | 0.281438 | 0.290196 | 0.298953 | 0.304363 | 0.313121 |
| Pivot points | S3 | S2 | S1 | PP | R1 | R2 | R3 |
|---|---|---|---|---|---|---|---|
| Standard | 0.240140 | 0.258970 | 0.281492 | 0.300322 | 0.322844 | 0.341674 | 0.364196 |
| Camarilla | 0.292642 | 0.296433 | 0.300223 | 0.304014 | 0.307805 | 0.311595 | 0.315386 |
| Woodie | 0.241986 | 0.259893 | 0.283338 | 0.301245 | 0.324690 | 0.342597 | 0.366042 |
| Fibonacci | 0.258970 | 0.274767 | 0.284526 | 0.300322 | 0.316119 | 0.325878 | 0.341674 |
| Pivot points | S3 | S2 | S1 | PP | R1 | R2 | R3 |
|---|---|---|---|---|---|---|---|
| Standard | 0.052533 | 0.126322 | 0.198584 | 0.272373 | 0.344635 | 0.418424 | 0.490686 |
| Camarilla | 0.230683 | 0.244071 | 0.257459 | 0.270847 | 0.284235 | 0.297623 | 0.311011 |
| Woodie | 0.051771 | 0.125940 | 0.197822 | 0.271991 | 0.343873 | 0.418042 | 0.489924 |
| Fibonacci | 0.126322 | 0.182113 | 0.216581 | 0.272373 | 0.328164 | 0.362632 | 0.418424 |
Numerical data
The following is the status of technical indicators and moving averages registered at the time this technical analysis was created:
| RSI (14): | 45.02 | |
| MACD (12,26,9): | 0.0038 | |
| Directional Movement: | -7.335201 | |
| AROON (14): | 50.000000 | |
| DEMA (21): | 0.300915 | |
| Parabolic SAR (0,02-0,02-0,2): | 0.318353 | |
| Elder Ray (13): | -0.013713 | |
| Super Trend (3,10): | 0.241450 | |
| Zig ZAG (10): | 0.278517 | |
| VORTEX (21): | 0.9594 | |
| Stochastique (14,3,5): | 39.82 | |
| TEMA (21): | 0.292382 | |
| Williams %R (14): | -85.60 | |
| Chande Momentum Oscillator (20): | -0.014013 | |
| Repulse (5,40,3): | -6.3237 | |
| ROCnROLL: | -1 | |
| TRIX (15,9): | 0.3152 | |
| Courbe Coppock: | 6.37 |
| MA7: | 0.297539 | |
| MA20: | 0.292844 | |
| MA50: | 0.276805 | |
| MA100: | 0.228052 | |
| MAexp7: | 0.293341 | |
| MAexp20: | 0.293836 | |
| MAexp50: | 0.275777 | |
| MAexp100: | 0.258422 | |
| Price / MA7: | -5.66% | |
| Price / MA20: | -4.15% | |
| Price / MA50: | +1.41% | |
| Price / MA100: | +23.09% | |
| Price / MAexp7: | -4.31% | |
| Price / MAexp20: | -4.47% | |
| Price / MAexp50: | +1.79% | |
| Price / MAexp100: | +8.62% |
About author

Online


Add a comment
Comments
0 comments on the analysis CRYPTO 0X - ZRX/USD - Daily