DOGECOIN - DOGE/USD - Daily - Technical analysis published on 05/14/2021 (GMT)
- 173
- 0
Click here for a new analysis!
- Timeframe : Daily
- - Analysis generated on
- Status : INVALID

Summary of the analysis

Additional analysis
Quotes
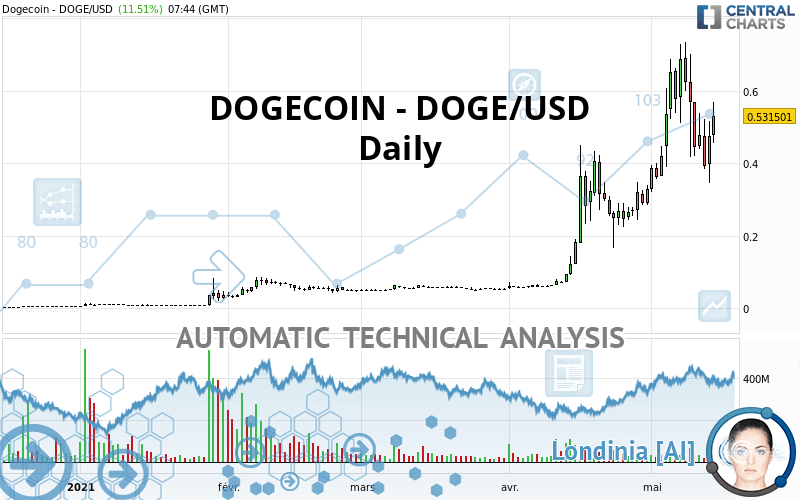
DOGECOIN - DOGE/USD rating 0.531501 USD. The price registered an increase of +11.51% on the session and was traded between 0.456317 USD and 0.569126 USD over the period. The price is currently at +16.48% from its lowest and -6.61% from its highest.The Central Gaps scanner detects a bullish opening marking the presence of buyers ahead of sellers at the opening but not sufficiently marked to allow the price to register a quotation gap.
Bullish opening
Type : Bullish
Timeframe : Openning
A study of price movements over other periods shows the following variations:
Technical
A technical analysis in Daily of this DOGECOIN - DOGE/USD chart shows a strongly bullish trend. 92.86% of the signals given by moving averages are bullish. The overall trend is supported by the strong bullish signals from short-term moving averages. The Central Indicators market scanner is currently detecting several bullish signals that could impact this trend:
Bullish price crossover with Moving Average 20
Type : Bullish
Timeframe : Daily
Bullish price crossover with adaptative moving average 20
Type : Bullish
Timeframe : Daily
Bullish price crossover with adaptative moving average 50
Type : Bullish
Timeframe : Daily
Bullish price crossover with adaptative moving average 100
Type : Bullish
Timeframe : Daily
In fact, according to the parameters integrated into the Central Analyzer system, only 7 technical indicators out of 18 analysed are currently bullish. Other results related to technical indicators were also found by the Central Indicators scanner:
RSI indicator is back over 50
Type : Bullish
Timeframe : Daily
Price is back over the pivot point
Type : Bullish
Timeframe : Daily
Price is back over the pivot point
Type : Bullish
Timeframe : Weekly
Central Patterns, the market scanner focusing on chart patterns, resistances and supports found this result:
Horizontal resistance is broken
Type : Bullish
Timeframe : Daily
Central Candlesticks, the scanner specialised in Japanese candlesticks, detects a bullish signal that could support the hypothesis of a small rebound in the very short term:
Bullish harami
Type : Bullish
Timeframe : Daily
| S3 | S2 | S1 | Price | R1 | |
|---|---|---|---|---|---|
| ProTrendLines | 0.078472 | 0.247107 | 0.407632 | 0.531501 | 0.689046 |
| Change (%) | -85.24% | -53.51% | -23.31% | - | +29.64% |
| Change | -0.453029 | -0.284394 | -0.123869 | - | +0.157545 |
| Level | Minor | Intermediate | Major | - | Minor |
Attention could also be paid to pivot points to set price objectives:
| Pivot points | S3 | S2 | S1 | PP | R1 | R2 | R3 |
|---|---|---|---|---|---|---|---|
| Standard | 0.206889 | 0.276592 | 0.376608 | 0.446311 | 0.546327 | 0.616030 | 0.716046 |
| Camarilla | 0.429951 | 0.445509 | 0.461066 | 0.476624 | 0.492182 | 0.507739 | 0.523297 |
| Woodie | 0.222046 | 0.284170 | 0.391765 | 0.453889 | 0.561484 | 0.623608 | 0.731203 |
| Fibonacci | 0.276592 | 0.341425 | 0.381478 | 0.446311 | 0.511144 | 0.551197 | 0.616030 |
| Pivot points | S3 | S2 | S1 | PP | R1 | R2 | R3 |
|---|---|---|---|---|---|---|---|
| Standard | 0.033630 | 0.195747 | 0.410791 | 0.572908 | 0.787952 | 0.950069 | 1.165113 |
| Camarilla | 0.522116 | 0.556689 | 0.591262 | 0.625835 | 0.660408 | 0.694981 | 0.729554 |
| Woodie | 0.060094 | 0.208979 | 0.437255 | 0.586140 | 0.814416 | 0.963301 | 1.191577 |
| Fibonacci | 0.195747 | 0.339823 | 0.428833 | 0.572908 | 0.716984 | 0.805994 | 0.950069 |
| Pivot points | S3 | S2 | S1 | PP | R1 | R2 | R3 |
|---|---|---|---|---|---|---|---|
| Standard | -0.294417 | -0.120562 | 0.104101 | 0.277956 | 0.502619 | 0.676474 | 0.901137 |
| Camarilla | 0.219173 | 0.255703 | 0.292234 | 0.328765 | 0.365296 | 0.401827 | 0.438358 |
| Woodie | -0.269012 | -0.107860 | 0.129506 | 0.290658 | 0.528024 | 0.689176 | 0.926542 |
| Fibonacci | -0.120562 | 0.031672 | 0.125722 | 0.277956 | 0.430190 | 0.524240 | 0.676474 |
Numerical data
The following is the status of the technical indicators and moving averages at the time of publication of this technical analysis:
| RSI (14): | 58.27 | |
| MACD (12,26,9): | 0.0720 | |
| Directional Movement: | 6.549765 | |
| AROON (14): | 57.142857 | |
| DEMA (21): | 0.547347 | |
| Parabolic SAR (0,02-0,02-0,2): | 0.687087 | |
| Elder Ray (13): | 0.031772 | |
| Super Trend (3,10): | 0.344338 | |
| Zig ZAG (10): | 0.530402 | |
| VORTEX (21): | 1.1199 | |
| Stochastique (14,3,5): | 39.91 | |
| TEMA (21): | 0.553249 | |
| Williams %R (14): | -47.42 | |
| Chande Momentum Oscillator (20): | 0.174383 | |
| Repulse (5,40,3): | 7.6967 | |
| ROCnROLL: | 1 | |
| TRIX (15,9): | 4.2170 | |
| Courbe Coppock: | 135.59 |
| MA7: | 0.504153 | |
| MA20: | 0.443745 | |
| MA50: | 0.262259 | |
| MA100: | 0.159617 | |
| MAexp7: | 0.498585 | |
| MAexp20: | 0.446473 | |
| MAexp50: | 0.316441 | |
| MAexp100: | 0.211712 | |
| Price / MA7: | +5.42% | |
| Price / MA20: | +19.78% | |
| Price / MA50: | +102.66% | |
| Price / MA100: | +232.99% | |
| Price / MAexp7: | +6.60% | |
| Price / MAexp20: | +19.04% | |
| Price / MAexp50: | +67.96% | |
| Price / MAexp100: | +151.05% |
About author

Online


Add a comment
Comments
0 comments on the analysis DOGECOIN - DOGE/USD - Daily