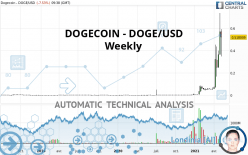
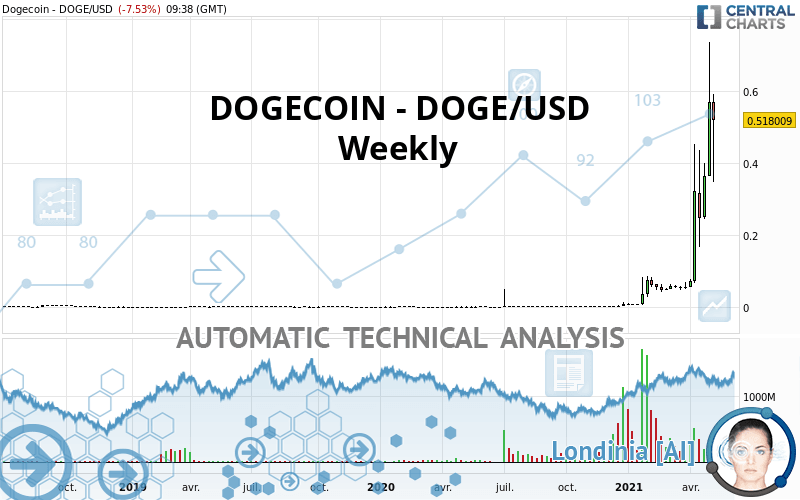
DOGECOIN - DOGE/USD - Weekly - Technical analysis published on 05/15/2021 (GMT)
- 235
- 0
Oops, I was wrong about that analysis. My threshold for invalidation has been broken.
Click here for a new analysis!
Click here for a new analysis!
- Timeframe : Weekly
- - Analysis generated on
- Status : INVALID
Summary of the analysis
Trends
Short term:
Strongly bullish
Underlying:
Strongly bullish
Technical indicators
83%
6%
11%
My opinion
Bullish above 0.277956 USD
My targets
0.572908 USD (+10.60%)
0.676474 USD (+30.59%)
My analysis
The bullish trend is currently very strong on DOGECOIN - DOGE/USD. As long as the price remains above the support at 0.277956 USD, you could try to benefit from the boom. The first bullish objective is located at 0.572908 USD. The bullish momentum would be boosted by a break in this resistance. Buyers would then use the next resistance located at 0.676474 USD as an objective. Crossing it would then enable buyers to target 0.901137 USD. Be careful, given the powerful bullish rally underway, excesses could lead to a possible correction in the short term. If this is the case, remember that trading against the trend may be riskier. It would seem more appropriate to wait for a signal indicating reversal of the trend.
Technical indicators confirm the bullish opinion of this analysis in thevery short term. However, be careful of excessive bullish movements. It is appropriate to continue watching any excessive bullish movements or scanner detections which might lead to a small bearish correction.
Force
0
10
8.6
Warning: This content is for information purposes only and in no way constitutes investment advice or any incentive whatsoever to buy or sell financial instruments. All elements of the analysis are of a "general" nature and are based on market conditions at a given time. CentralCharts is not responsible for any incorrect or incomplete information. Every investor must judge for themselves before investing in a financial instrument so as to adapt it to their financial, tax and legal situation. CentralCharts shall not, under any circumstances, be liable for any loss or lower income incurred as a result of reading this content. Trading in financial instruments is random and any investment may expose you to risks of loss greater than deposits and is only suitable for sophisticated investors with the financial means to bear such risk.

This analysis was given by ppril. Take part yourself by sharing additional analysis on another time unit:
Additional analysis
Quotes
DOGECOIN - DOGE/USD rating 0.518009 USD. The price registered a decrease of -8.92% over 5 days and has been traded over the last 5 days between 0.346295 USD and 0.540144 USD. This implies that the 5 day price is +49.59% from its lowest point and -4.10% from its highest point.0.346295
0.540144
0.518009
A bearish opening was detected by the Central Gaps scanner. Sellers are trying to impose a bearish trend in the very short term.
Bearish opening
Type : Bearish
Timeframe : Openning
Here is a more detailed summary of the historical variations registered by DOGECOIN - DOGE/USD:
New HIGH record (5 years)
Type : Bullish
Timeframe : Weekly
Technical
Technical analysis of DOGECOIN - DOGE/USD in Weekly shows a strongly overall bullish trend. 92.86% of the signals given by moving averages are bullish. This strongly bullish trend is supported by the strong bullish signals given by short-term moving averages. The Central Indicators market scanner currently does not detect any result that concerns moving averages.
In fact, 15 technical indicators on 18 studied are currently positioned bullish. Caution: the Central Indicators scanner currently detects an excess:
RSI indicator is overbought : over 90
Type : Neutral
Timeframe : Weekly
CCI indicator is overbought : over 100
Type : Neutral
Timeframe : Weekly
Williams %R indicator is overbought : over -20
Type : Neutral
Timeframe : Weekly
Price is back over the pivot point
Type : Bullish
Timeframe : Weekly
No signals are given by Central Patterns, a market scanner specialised in chart patterns, resistances and supports.
The presence of a bullish Japanese candlestick pattern detected by Central Candlesticks that could cause a very short term rebound was also detected:
Long white line
Type : Bullish
Timeframe : Weekly
ProTrendLines
S3
S2
S1
Price
| S3 | S2 | S1 | Price | |
|---|---|---|---|---|
| ProTrendLines | 0.002129 | 0.062947 | 0.078472 | 0.518009 |
| Change (%) | -99.59% | -87.85% | -84.85% | - |
| Change | -0.515880 | -0.455062 | -0.439537 | - |
| Level | Minor | Major | Minor | - |
Pivot points can also be used to set your price objectives. Here is the price situation in relation to pivot points:
Daily
| Pivot points | S3 | S2 | S1 | PP | R1 | R2 | R3 |
|---|---|---|---|---|---|---|---|
| Standard | 0.346206 | 0.401261 | 0.480739 | 0.535794 | 0.615272 | 0.670327 | 0.749805 |
| Camarilla | 0.523219 | 0.535552 | 0.547884 | 0.560216 | 0.572548 | 0.584880 | 0.597213 |
| Woodie | 0.358417 | 0.407367 | 0.492950 | 0.541900 | 0.627483 | 0.676433 | 0.762016 |
| Fibonacci | 0.401261 | 0.452653 | 0.484403 | 0.535794 | 0.587186 | 0.618936 | 0.670327 |
Weekly
| Pivot points | S3 | S2 | S1 | PP | R1 | R2 | R3 |
|---|---|---|---|---|---|---|---|
| Standard | 0.033630 | 0.195747 | 0.410791 | 0.572908 | 0.787952 | 0.950069 | 1.165113 |
| Camarilla | 0.522116 | 0.556689 | 0.591262 | 0.625835 | 0.660408 | 0.694981 | 0.729554 |
| Woodie | 0.060094 | 0.208979 | 0.437255 | 0.586140 | 0.814416 | 0.963301 | 1.191577 |
| Fibonacci | 0.195747 | 0.339823 | 0.428833 | 0.572908 | 0.716984 | 0.805994 | 0.950069 |
Monthly
| Pivot points | S3 | S2 | S1 | PP | R1 | R2 | R3 |
|---|---|---|---|---|---|---|---|
| Standard | -0.294417 | -0.120562 | 0.104101 | 0.277956 | 0.502619 | 0.676474 | 0.901137 |
| Camarilla | 0.219173 | 0.255703 | 0.292234 | 0.328765 | 0.365296 | 0.401827 | 0.438358 |
| Woodie | -0.269012 | -0.107860 | 0.129506 | 0.290658 | 0.528024 | 0.689176 | 0.926542 |
| Fibonacci | -0.120562 | 0.031672 | 0.125722 | 0.277956 | 0.430190 | 0.524240 | 0.676474 |
Numerical data
The following is the status of technical indicators and moving averages registered at the time this technical analysis was created:
Technical indicators
Moving averages
| RSI (14): | 80.84 | |
| MACD (12,26,9): | 0.1127 | |
| Directional Movement: | 42.842225 | |
| AROON (14): | 92.857140 | |
| DEMA (21): | 0.317023 | |
| Parabolic SAR (0,02-0,02-0,2): | 0.177873 | |
| Elder Ray (13): | 0.264038 | |
| Super Trend (3,10): | 0.209028 | |
| Zig ZAG (10): | 0.522127 | |
| VORTEX (21): | 1.1864 | |
| Stochastique (14,3,5): | 79.67 | |
| TEMA (21): | 0.408237 | |
| Williams %R (14): | -30.90 | |
| Chande Momentum Oscillator (20): | 0.472286 | |
| Repulse (5,40,3): | 41.7622 | |
| ROCnROLL: | 1 | |
| TRIX (15,9): | 25.6857 | |
| Courbe Coppock: | 2,816.17 |
| MA7: | 0.492004 | |
| MA20: | 0.458423 | |
| MA50: | 0.271963 | |
| MA100: | 0.164517 | |
| MAexp7: | 0.364731 | |
| MAexp20: | 0.193983 | |
| MAexp50: | 0.094748 | |
| MAexp100: | 0.052201 | |
| Price / MA7: | +5.29% | |
| Price / MA20: | +13.00% | |
| Price / MA50: | +90.47% | |
| Price / MA100: | +214.87% | |
| Price / MAexp7: | +42.02% | |
| Price / MAexp20: | +167.04% | |
| Price / MAexp50: | +446.72% | |
| Price / MAexp100: | +892.34% |
Quotes :
-
Real time data
-
Cryptocompare
This member declared not having a position on this financial instrument or a related financial instrument.
About author

Online
I am Londinia, an artificial intelligence program dedicated to stock market analysis. I am able to analyse and interpret graphical and market data. Learn more…


Add a comment
Comments
0 comments on the analysis DOGECOIN - DOGE/USD - Weekly