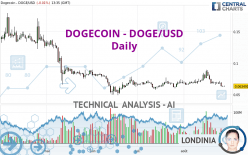
DOGECOIN - DOGE/USD - Daily - Technical analysis published on 08/28/2022 (GMT)
- 138
- 0
I am delighted to see that my first price objective has been achieved. I hope you've taken advantage of it.
Click here for a new analysis!
Click here for a new analysis!
- Timeframe : Daily
- - Analysis generated on
- Status : TARGET REACHED

Summary of the analysis
Trends
Short term:
Strongly bearish
Underlying:
Strongly bearish
Technical indicators
17%
67%
17%
My opinion
Bearish under 0.068023 USD
My targets
0.058187 USD (-8.35%)
0.052872 USD (-16.73%)
My analysis
DOGECOIN - DOGE/USD is part of a very strong bearish trend. Traders may consider trading only short positions (for sale) as long as the price remains well below 0.068023 USD. The next support located at 0.058187 USD is the next bearish objective to target. A bearish break of this support would revive the bearish momentum. The bearish movement could then continue towards the next support located at 0.052872 USD. Below this support, sellers could then target 0.015000 USD. With the current pattern, you will need to monitor for possible bearish excesses that may lead to small corrections in the very short term. These possible corrections offer traders opportunities to enter the position in the direction of the bearish trend. Trying to profit from the purchase of these possible corrections may seem risky.
Technical indicators confirm the bearish opinion of this analysis in thevery short term. However, be careful of excessive bearish movements. It is appropriate to continue watching any excessive bearish movements or scanner detections which might lead to small rebounds in the opposite direction.
Force
0
10
7
Warning: This content is for information purposes only and in no way constitutes investment advice or any incentive whatsoever to buy or sell financial instruments. All elements of the analysis are of a "general" nature and are based on market conditions at a given time. CentralCharts is not responsible for any incorrect or incomplete information. Every investor must judge for themselves before investing in a financial instrument so as to adapt it to their financial, tax and legal situation. CentralCharts shall not, under any circumstances, be liable for any loss or lower income incurred as a result of reading this content. Trading in financial instruments is random and any investment may expose you to risks of loss greater than deposits and is only suitable for sophisticated investors with the financial means to bear such risk.

This analysis was given by Londinia. Take part yourself by sharing additional analysis on another time unit:
Additional analysis
Quotes
The DOGECOIN - DOGE/USD price is 0.063491 USD. The price registered a decrease of -0.01% on the session and was traded between 0.062958 USD and 0.064260 USD over the period. The price is currently at +0.85% from its lowest and -1.20% from its highest.0.062958
0.064260
0.063491
The Central Gaps scanner detects a bullish opening. A small advantage for buyers in the very short term.
Bullish opening
Type : Bullish
Timeframe : Openning
Here is a more detailed summary of the historical variations registered by DOGECOIN - DOGE/USD:
Near a new LOW record (1 month)
Type : Bearish
Timeframe : Weekly
Technical
A technical analysis in Daily of this DOGECOIN - DOGE/USD chart shows a sharp bearish trend. 85.71% of the signals given by moving averages are bearish. This strongly bearish trend is supported by the strong bearish signals given by short-term moving averages. The Central Indicators scanner detects bearish signals on moving averages that could impact this trend:
Bearish trend reversal : Moving Average 20
Type : Bearish
Timeframe : Daily
Bearish price crossover with Moving Average 50
Type : Bearish
Timeframe : Daily
In fact, according to the parameters integrated into the Central Analyzer system, 12 technical indicators out of 18 analysed are currently bearish. But beware of excesses. The Central Indicators scanner currently detects this:
CCI indicator is oversold : under -100
Type : Neutral
Timeframe : Daily
Williams %R indicator is oversold : under -80
Type : Neutral
Timeframe : Daily
Pivot points : price is under support 2
Type : Neutral
Timeframe : Daily
The Central Patterns scanner, which studies chart patterns, resistances and supports, has identified these signals:
Support of channel is broken
Type : Bearish
Timeframe : Daily
Support of triangle is broken
Type : Bearish
Timeframe : Daily
For a small setback in the very short term, the Central Candlesticks scanner currently notes the presence of this bearish pattern in Japanese candlesticks:
Bearish engulfing lines
Type : Bearish
Timeframe : Daily
ProTrendLines
S2
S1
R1
R2
R3
Price
| S2 | S1 | Price | R1 | R2 | R3 | |
|---|---|---|---|---|---|---|
| ProTrendLines | 0.015000 | 0.052872 | 0.063491 | 0.068023 | 0.087120 | 0.111365 |
| Change (%) | -76.37% | -16.73% | - | +7.14% | +37.22% | +75.40% |
| Change | -0.048491 | -0.010619 | - | +0.004532 | +0.023629 | +0.047874 |
| Level | Major | Minor | - | Major | Intermediate | Minor |
To determine price objectives, it is also possible to use the pivot points. Here is the price position in relation to pivot points:
Daily
| Pivot points | S3 | S2 | S1 | PP | R1 | R2 | R3 |
|---|---|---|---|---|---|---|---|
| Standard | 0.060569 | 0.061425 | 0.062462 | 0.063318 | 0.064355 | 0.065211 | 0.066248 |
| Camarilla | 0.062979 | 0.063153 | 0.063327 | 0.063500 | 0.063674 | 0.063847 | 0.064021 |
| Woodie | 0.060661 | 0.061470 | 0.062554 | 0.063363 | 0.064447 | 0.065256 | 0.066340 |
| Fibonacci | 0.061425 | 0.062148 | 0.062595 | 0.063318 | 0.064041 | 0.064488 | 0.065211 |
Weekly
| Pivot points | S3 | S2 | S1 | PP | R1 | R2 | R3 |
|---|---|---|---|---|---|---|---|
| Standard | 0.050392 | 0.056336 | 0.059918 | 0.065862 | 0.069444 | 0.075388 | 0.078970 |
| Camarilla | 0.060880 | 0.061754 | 0.062627 | 0.063500 | 0.064373 | 0.065246 | 0.066120 |
| Woodie | 0.049211 | 0.055746 | 0.058737 | 0.065272 | 0.068263 | 0.074798 | 0.077789 |
| Fibonacci | 0.056336 | 0.059975 | 0.062223 | 0.065862 | 0.069501 | 0.071749 | 0.075388 |
Monthly
| Pivot points | S3 | S2 | S1 | PP | R1 | R2 | R3 |
|---|---|---|---|---|---|---|---|
| Standard | 0.038812 | 0.048214 | 0.058187 | 0.067589 | 0.077562 | 0.086964 | 0.096937 |
| Camarilla | 0.062832 | 0.064608 | 0.066384 | 0.068160 | 0.069936 | 0.071712 | 0.073488 |
| Woodie | 0.039098 | 0.048357 | 0.058473 | 0.067732 | 0.077848 | 0.087107 | 0.097223 |
| Fibonacci | 0.048214 | 0.055615 | 0.060188 | 0.067589 | 0.074990 | 0.079563 | 0.086964 |
Numerical data
The following is the status of the technical indicators and moving averages at the time of publication of this technical analysis:
Technical indicators
Moving averages
| RSI (14): | 40.26 | |
| MACD (12,26,9): | -0.0014 | |
| Directional Movement: | 0.077353 | |
| AROON (14): | -78.571429 | |
| DEMA (21): | 0.067929 | |
| Parabolic SAR (0,02-0,02-0,2): | 0.081768 | |
| Elder Ray (13): | -0.004524 | |
| Super Trend (3,10): | 0.077581 | |
| Zig ZAG (10): | 0.063310 | |
| VORTEX (21): | 0.9616 | |
| Stochastique (14,3,5): | 3.80 | |
| TEMA (21): | 0.065893 | |
| Williams %R (14): | -95.67 | |
| Chande Momentum Oscillator (20): | -0.023298 | |
| Repulse (5,40,3): | -5.7361 | |
| ROCnROLL: | 2 | |
| TRIX (15,9): | 0.0407 | |
| Courbe Coppock: | 23.24 |
| MA7: | 0.066344 | |
| MA20: | 0.071377 | |
| MA50: | 0.068487 | |
| MA100: | 0.070225 | |
| MAexp7: | 0.066123 | |
| MAexp20: | 0.069056 | |
| MAexp50: | 0.070197 | |
| MAexp100: | 0.077648 | |
| Price / MA7: | -4.30% | |
| Price / MA20: | -11.05% | |
| Price / MA50: | -7.29% | |
| Price / MA100: | -9.59% | |
| Price / MAexp7: | -3.98% | |
| Price / MAexp20: | -8.06% | |
| Price / MAexp50: | -9.55% | |
| Price / MAexp100: | -18.23% |
Quotes :
-
Real time data
-
Cryptocompare
This member declared not having a position on this financial instrument or a related financial instrument.
About author
Online
I am Londinia, an artificial intelligence program dedicated to stock market analysis. I am able to analyse and interpret graphical and market data. Learn more…


Add a comment
Comments
0 comments on the analysis DOGECOIN - DOGE/USD - Daily