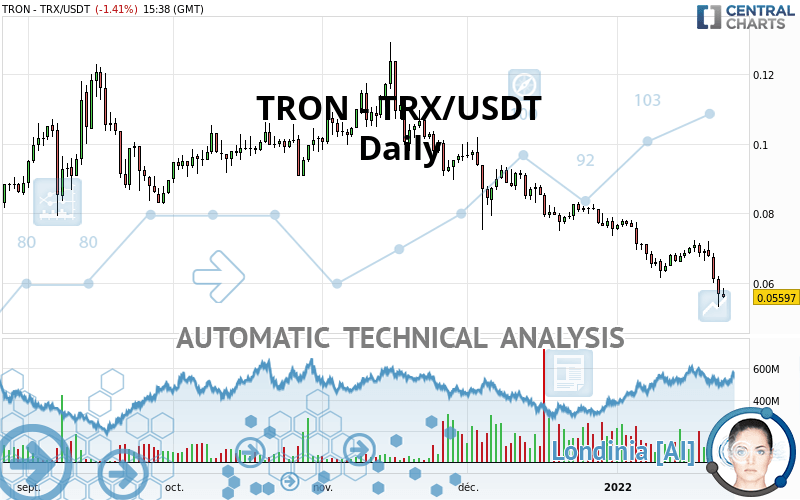
TRON - TRX/USDT - Daily - Technical analysis published on 01/23/2022 (GMT)
- 151
- 0
Click here for a new analysis!
- Timeframe : Daily
- - Analysis generated on
- Status : INVALID
Summary of the analysis

Additional analysis
Quotes
The TRON - TRX/USDT rating is 0.055970 USDT. The price is lower by -1.41% since the last closing with the lowest point at 0.055500 USDT and the highest point at 0.058510 USDT. The deviation from the price is +0.85% for the low point and -4.34% for the high point.A bearish opening was detected by the Central Gaps scanner. Sellers are trying to impose a bearish trend in the very short term.
Bearish opening
Type : Bearish
Timeframe : Openning
A study of price movements over other periods shows the following variations:
New LOW record (1st january)
Type : Bearish
Timeframe : Weekly
Near a new LOW record (1st january)
Type : Bearish
Timeframe : Weekly
New LOW record (1 month)
Type : Bearish
Timeframe : Weekly
Near a new LOW record (1 month)
Type : Bearish
Timeframe : Weekly
The Central Volumes scanner detects abnormal volumes on the asset:
Abnormal volumes
Timeframe : 50 days
Technical
A technical analysis in Daily of this TRON - TRX/USDT chart shows a sharp bearish trend. 92.86% of the signals given by moving averages are bearish. This strongly bearish trend is supported by the strong bearish signals given by short-term moving averages. There is no crossing of moving average by the price or crossing of moving averages between themselves.
An assessment of technical indicators does not currently provide any relevant information to suggest whether the signal given by the technical indicators is more bullish or bearish.
Caution: the Central Indicators scanner currently detects an excess:
RSI indicator is oversold : under 30
Type : Neutral
Timeframe : Daily
CCI indicator is oversold : under -100
Type : Neutral
Timeframe : Daily
Previous candle closed under Bollinger bands
Type : Neutral
Timeframe : Daily
Williams %R indicator is oversold : under -80
Type : Neutral
Timeframe : Daily
Pivot points : price is under support 1
Type : Neutral
Timeframe : Weekly
Pivot points : price is under support 3
Type : Neutral
Timeframe : Daily
Parabolic SAR indicator bearish reversal
Type : Bearish
Timeframe : Daily
Momentum indicator is back under 0
Type : Bearish
Timeframe : Daily
Williams %R indicator is back under -50
Type : Bearish
Timeframe : Daily
The analysis of the price chart with Central Patterns scanners does not return any result.
No result was found by the Central Candlesticks scanner on Japanese candlesticks.
| S3 | S2 | S1 | Price | R1 | R2 | R3 | |
|---|---|---|---|---|---|---|---|
| ProTrendLines | 0.012628 | 0.025503 | 0.050523 | 0.055970 | 0.063450 | 0.075320 | 0.082967 |
| Change (%) | -77.44% | -54.43% | -9.73% | - | +13.36% | +34.57% | +48.23% |
| Change | -0.043342 | -0.030467 | -0.005447 | - | +0.007480 | +0.019350 | +0.026997 |
| Level | Minor | Intermediate | Major | - | Intermediate | Minor | Major |
To determine price objectives, it is also possible to use the pivot points. Here is the price position in relation to pivot points:
| Pivot points | S3 | S2 | S1 | PP | R1 | R2 | R3 |
|---|---|---|---|---|---|---|---|
| Standard | 0.043620 | 0.048330 | 0.052550 | 0.057260 | 0.061480 | 0.066190 | 0.070410 |
| Camarilla | 0.054314 | 0.055133 | 0.055951 | 0.056770 | 0.057589 | 0.058407 | 0.059226 |
| Woodie | 0.043375 | 0.048208 | 0.052305 | 0.057138 | 0.061235 | 0.066068 | 0.070165 |
| Fibonacci | 0.048330 | 0.051741 | 0.053849 | 0.057260 | 0.060671 | 0.062779 | 0.066190 |
| Pivot points | S3 | S2 | S1 | PP | R1 | R2 | R3 |
|---|---|---|---|---|---|---|---|
| Standard | 0.029700 | 0.041370 | 0.049070 | 0.060740 | 0.068440 | 0.080110 | 0.087810 |
| Camarilla | 0.051443 | 0.053219 | 0.054994 | 0.056770 | 0.058546 | 0.060321 | 0.062097 |
| Woodie | 0.027715 | 0.040378 | 0.047085 | 0.059748 | 0.066455 | 0.079118 | 0.085825 |
| Fibonacci | 0.041370 | 0.048769 | 0.053341 | 0.060740 | 0.068139 | 0.072711 | 0.080110 |
| Pivot points | S3 | S2 | S1 | PP | R1 | R2 | R3 |
|---|---|---|---|---|---|---|---|
| Standard | 0.047833 | 0.060697 | 0.068023 | 0.080887 | 0.088213 | 0.101077 | 0.108403 |
| Camarilla | 0.069798 | 0.071649 | 0.073499 | 0.075350 | 0.077201 | 0.079052 | 0.080902 |
| Woodie | 0.045065 | 0.059313 | 0.065255 | 0.079503 | 0.085445 | 0.099693 | 0.105635 |
| Fibonacci | 0.060697 | 0.068409 | 0.073174 | 0.080887 | 0.088599 | 0.093364 | 0.101077 |
Numerical data
The following is the status of the technical indicators and moving averages at the time of publication of this technical analysis:
| RSI (14): | 25.74 | |
| MACD (12,26,9): | -0.0046 | |
| Directional Movement: | -27.382115 | |
| AROON (14): | -35.714286 | |
| DEMA (21): | 0.061194 | |
| Parabolic SAR (0,02-0,02-0,2): | 0.071396 | |
| Elder Ray (13): | -0.007842 | |
| Super Trend (3,10): | 0.069832 | |
| Zig ZAG (10): | 0.055910 | |
| VORTEX (21): | 0.7489 | |
| Stochastique (14,3,5): | 14.16 | |
| TEMA (21): | 0.060713 | |
| Williams %R (14): | -85.18 | |
| Chande Momentum Oscillator (20): | -0.009020 | |
| Repulse (5,40,3): | -15.8475 | |
| ROCnROLL: | 2 | |
| TRIX (15,9): | -0.7612 | |
| Courbe Coppock: | 15.60 |
| MA7: | 0.064274 | |
| MA20: | 0.066818 | |
| MA50: | 0.076298 | |
| MA100: | 0.089205 | |
| MAexp7: | 0.062153 | |
| MAexp20: | 0.067192 | |
| MAexp50: | 0.075474 | |
| MAexp100: | 0.082262 | |
| Price / MA7: | -12.92% | |
| Price / MA20: | -16.24% | |
| Price / MA50: | -26.64% | |
| Price / MA100: | -37.26% | |
| Price / MAexp7: | -9.95% | |
| Price / MAexp20: | -16.70% | |
| Price / MAexp50: | -25.84% | |
| Price / MAexp100: | -31.96% |
About author

Online


Add a comment
Comments
0 comments on the analysis TRON - TRX/USDT - Daily