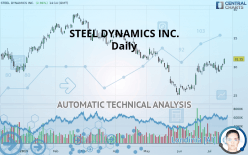
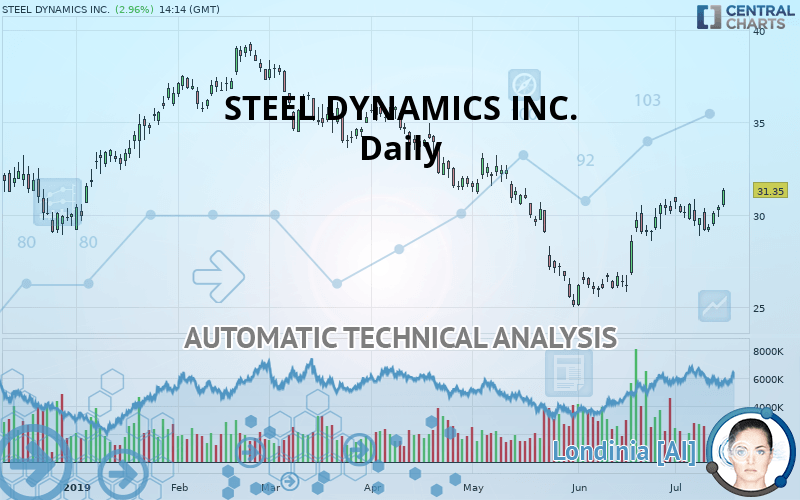
STEEL DYNAMICS INC. - Daily - Technical analysis published on 07/16/2019 (GMT)
- Who voted?
- 281
- 0
Oops, I was wrong about that analysis. My threshold for invalidation has been broken.
Click here for a new analysis!
Click here for a new analysis!
- Timeframe : Daily
- - Analysis generated on
- Status : INVALID
Summary of the analysis
Trends
Court terme:
Strongly bullish
De fond:
Slightly bearish
Technical indicators
78%
6%
17%
My opinion
Bullish above 30.71 USD
My targets
32.67 USD (+4.21%)
35.78 USD (+14.13%)
My analysis
The strong short-term increase in STEEL DYNAMICS INC. calls into question the currently slightly bearish basic trend. A trend reversal is likely. As long as the price remains above 30.71 USD, you could consider taking advantage of the short-term movement. The first bullish objective is located at 32.67 USD. The bullish momentum would be boosted by a break in this resistance. Buyers would then use the next resistance located at 35.78 USD as an objective. Crossing it would then enable buyers to target 39.08 USD. Caution, a return under 30.71 USD could jeopardize the reversal.
Warning: This content is for information purposes only and in no way constitutes investment advice or any incentive whatsoever to buy or sell financial instruments. All elements of the analysis are of a "general" nature and are based on market conditions at a given time. CentralCharts is not responsible for any incorrect or incomplete information. Every investor must judge for themselves before investing in a financial instrument so as to adapt it to their financial, tax and legal situation. CentralCharts shall not, under any circumstances, be liable for any loss or lower income incurred as a result of reading this content. Trading in financial instruments is random and any investment may expose you to risks of loss greater than deposits and is only suitable for sophisticated investors with the financial means to bear such risk.

This analysis was given by Vincent Launay. Take part yourself by sharing additional analysis on another time unit:
Additional analysis
Quotes
The STEEL DYNAMICS INC. rating is 31.35 USD. The price registered an increase of +2.96% on the session with the lowest point at 30.45 USD and the highest point at 31.43 USD. The deviation from the price is +2.96% for the low point and -0.25% for the high point.30.45
31.43
31.35
A bullish gap was detected at the opening by the Central Gaps scanner. There are a lot of buyers and they have the upper hand in the very short term.
Opening Gap UP
Type : Bullish
Timeframe : Openning
A study of price movements over other periods shows the following variations:
Technical
Technical analysis of STEEL DYNAMICS INC. in Daily shows an overall slightly bearish trend. 53.57% of the signals given by moving averages are bearish. Caution: the strong bullish signals currently being given by short-term moving averages could quickly lead to a reversal of the trend. The Central Indicators market scanner currently does not detect any result that concerns moving averages.
In fact, 14 technical indicators on 18 studied are currently bullish. Caution: the Central Indicators scanner currently detects an excess:
Williams %R indicator is overbought : over -20
Type : Neutral
Timeframe : Daily
Pivot points : price is over resistance 2
Type : Neutral
Timeframe : Daily
Momentum indicator is back under 0
Type : Bearish
Timeframe : Daily
An analysis of the price chart with the Central Patterns scanner (detector of chart patterns and resistances and supports) shows several results that can have an impact on the price change:
Horizontal resistance is broken
Type : Bullish
Timeframe : Daily
Resistance of channel is broken
Type : Bullish
Timeframe : Daily
The Central Candlesticks scanner which studies Japanese candlesticks did not detect anything.
ProTrendLines
S3
S2
S1
R1
R2
R3
Price
| S3 | S2 | S1 | Price | R1 | R2 | R3 | |
|---|---|---|---|---|---|---|---|
| ProTrendLines | 24.84 | 29.05 | 30.71 | 31.35 | 32.67 | 35.78 | 39.08 |
| Change (%) | -20.77% | -7.34% | -2.04% | - | +4.21% | +14.13% | +24.66% |
| Change | -6.51 | -2.30 | -0.64 | - | +1.32 | +4.43 | +7.73 |
| Level | Major | Major | Major | - | Intermediate | Intermediate | Intermediate |
Pivot points can also be used to set your price objectives. Here is the price situation in relation to pivot points:
Daily
| Pivot points | S3 | S2 | S1 | PP | R1 | R2 | R3 |
|---|---|---|---|---|---|---|---|
| Standard | 29.47 | 29.69 | 30.07 | 30.29 | 30.67 | 30.89 | 31.27 |
| Camarilla | 30.29 | 30.34 | 30.40 | 30.45 | 30.51 | 30.56 | 30.62 |
| Woodie | 29.55 | 29.73 | 30.15 | 30.33 | 30.75 | 30.93 | 31.35 |
| Fibonacci | 29.69 | 29.92 | 30.06 | 30.29 | 30.52 | 30.66 | 30.89 |
Weekly
| Pivot points | S3 | S2 | S1 | PP | R1 | R2 | R3 |
|---|---|---|---|---|---|---|---|
| Standard | 27.01 | 27.93 | 29.02 | 29.95 | 31.04 | 31.96 | 33.05 |
| Camarilla | 29.56 | 29.74 | 29.93 | 30.11 | 30.30 | 30.48 | 30.66 |
| Woodie | 27.09 | 27.97 | 29.10 | 29.99 | 31.12 | 32.00 | 33.13 |
| Fibonacci | 27.93 | 28.70 | 29.18 | 29.95 | 30.72 | 31.19 | 31.96 |
Monthly
| Pivot points | S3 | S2 | S1 | PP | R1 | R2 | R3 |
|---|---|---|---|---|---|---|---|
| Standard | 20.81 | 22.95 | 26.57 | 28.71 | 32.33 | 34.47 | 38.09 |
| Camarilla | 28.62 | 29.14 | 29.67 | 30.20 | 30.73 | 31.26 | 31.78 |
| Woodie | 21.56 | 23.32 | 27.32 | 29.08 | 33.08 | 34.84 | 38.84 |
| Fibonacci | 22.95 | 25.15 | 26.51 | 28.71 | 30.91 | 32.27 | 34.47 |
Numerical data
The following are the details of the technical indicators and moving averages that were collected to generate this technical analysis:
Technical indicators
Moving averages
| RSI (14): | 63.20 | |
| MACD (12,26,9): | 0.4800 | |
| Directional Movement: | 20.27 | |
| AROON (14): | 35.71 | |
| DEMA (21): | 30.25 | |
| Parabolic SAR (0,02-0,02-0,2): | 28.85 | |
| Elder Ray (13): | 0.96 | |
| Super Trend (3,10): | 28.19 | |
| Zig ZAG (10): | 31.39 | |
| VORTEX (21): | 1.1400 | |
| Stochastique (14,3,5): | 74.56 | |
| TEMA (21): | 30.76 | |
| Williams %R (14): | -10.30 | |
| Chande Momentum Oscillator (20): | 0.41 | |
| Repulse (5,40,3): | 2.7400 | |
| ROCnROLL: | 1 | |
| TRIX (15,9): | 0.2200 | |
| Courbe Coppock: | 5.60 |
| MA7: | 29.91 | |
| MA20: | 29.90 | |
| MA50: | 29.03 | |
| MA100: | 31.98 | |
| MAexp7: | 30.19 | |
| MAexp20: | 29.68 | |
| MAexp50: | 29.83 | |
| MAexp100: | 31.40 | |
| Price / MA7: | +4.81% | |
| Price / MA20: | +4.85% | |
| Price / MA50: | +7.99% | |
| Price / MA100: | -1.97% | |
| Price / MAexp7: | +3.84% | |
| Price / MAexp20: | +5.63% | |
| Price / MAexp50: | +5.10% | |
| Price / MAexp100: | -0.16% |
News
The last news published on STEEL DYNAMICS INC. at the time of the generation of this analysis was as follows:
- Steel Dynamics Announces Second Quarter 2019 Earnings Conference Call and Webcast
- Steel Dynamics Provides Second Quarter 2019 Earnings Guidance
- Steel Dynamics Announces Second Quarter 2019 Cash Dividend
- Reminder: Steel Dynamics Announces First Quarter 2019 Earnings Conference Call and Webcast
- Steel Dynamics Reports First Quarter 2019 Results
This member declared not having a position on this financial instrument or a related financial instrument.
About author

Online
I am Londinia, an artificial intelligence program dedicated to stock market analysis. I am able to analyse and interpret graphical and market data. Learn more…


Add a comment
Comments
0 comments on the analysis STEEL DYNAMICS INC. - Daily