TETHER - USDT/USD - Daily - Technical analysis published on 04/10/2021 (GMT)
- 322
- 0
- Timeframe : Daily
- - Analysis generated on
- Status : NEUTRAL

Summary of the analysis

Additional analysis
Quotes
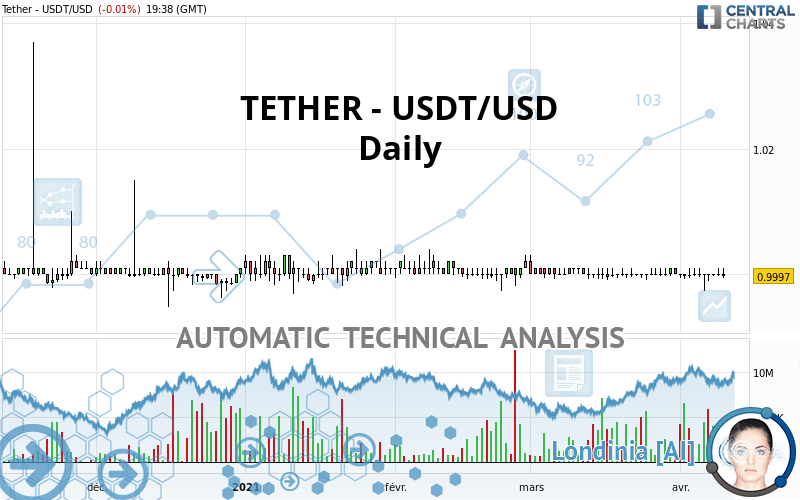
The TETHER - USDT/USD price is 1.00 USD. On the day, this instrument lost -0.01% and was between 1.00 USD and 1.00 USD. This implies that the price is at +0.04% from its lowest and at -0.13% from its highest.The Central Gaps scanner detects a bullish opening. A small advantage for buyers in the very short term.
Bullish opening
Type : Bullish
Timeframe : Openning
Here is a more detailed summary of the historical variations registered by TETHER - USDT/USD:
Near a new LOW record (1 month)
Type : Bearish
Timeframe : Weekly
The Central Volumes scanner detects abnormal volumes on the asset:
Abnormal volumes
Timeframe : 5 days
Abnormal volumes
Timeframe : 20 days
Abnormal volumes
Timeframe : 50 days
Technical
Technical analysis of TETHER - USDT/USD in Daily shows a neutral overall trend. This generally neutral trend is confirmed by the neutral signals currently given by short-term moving averages. An assessment of moving averages reveals several bearish signals that could impact this trend:
Bearish trend reversal : Moving Average 100
Type : Bearish
Timeframe : Daily
Bearish price crossover with Moving Average 20
Type : Bearish
Timeframe : Daily
Technical indicators are slightly bullish. There is therefore considerable uncertainty about the continuation of the increase.
Caution: the Central Indicators scanner currently detects an excess:
CCI indicator: bullish divergence
Type : Bullish
Timeframe : Daily
MACD indicator: bearish divergence
Type : Bearish
Timeframe : Daily
Pivot points : price is over resistance 1
Type : Neutral
Timeframe : Weekly
Pivot points : price is over resistance 3
Type : Neutral
Timeframe : Daily
Pivot points : price is under support 2
Type : Neutral
Timeframe : Daily
MACD crosses DOWN its Moving Average
Type : Bearish
Timeframe : Daily
Parabolic SAR indicator bullish reversal
Type : Bullish
Timeframe : Daily
Aroon indicator bullish trend
Type : Bullish
Timeframe : Daily
Price is back under the pivot point
Type : Bearish
Timeframe : Weekly
Central Patterns, the market scanner focusing on chart patterns, resistances and supports found these results:
Near support of channel
Type : Bullish
Timeframe : Daily
Near support of triangle
Type : Bullish
Timeframe : Daily
Horizontal support is broken
Type : Bearish
Timeframe : Daily
The Central Candlesticks scanner, specialised in Japanese candlesticks, did not identify any signals.
| S3 | S2 | S1 | Price | R1 | R2 | R3 | |
|---|---|---|---|---|---|---|---|
| ProTrendLines | 0.99 | 1.00 | 1.00 | 1.00 | 1.00 | 1.00 | 1.00 |
| Change (%) | -1.36% | -0.12% | -0.07% | - | +0.01% | +0.13% | +0.21% |
| Change | -0.01 | +0.00 | +0.00 | - | +0.00 | +0.00 | +0.00 |
| Level | Intermediate | Minor | Minor | - | Major | Major | Major |
Attention could also be paid to pivot points to set price objectives:
| Pivot points | S3 | S2 | S1 | PP | R1 | R2 | R3 |
|---|---|---|---|---|---|---|---|
| Standard | 1.00 | 1.00 | 1.00 | 1.00 | 1.00 | 1.00 | 1.00 |
| Camarilla | 1.00 | 1.00 | 1.00 | 1.00 | 1.00 | 1.00 | 1.00 |
| Woodie | 1.00 | 1.00 | 1.00 | 1.00 | 1.00 | 1.00 | 1.00 |
| Fibonacci | 1.00 | 1.00 | 1.00 | 1.00 | 1.00 | 1.00 | 1.00 |
| Pivot points | S3 | S2 | S1 | PP | R1 | R2 | R3 |
|---|---|---|---|---|---|---|---|
| Standard | 0.99 | 1.00 | 1.00 | 1.00 | 1.00 | 1.00 | 1.01 |
| Camarilla | 1.00 | 1.00 | 1.00 | 1.00 | 1.00 | 1.00 | 1.00 |
| Woodie | 0.99 | 1.00 | 1.00 | 1.00 | 1.00 | 1.00 | 1.01 |
| Fibonacci | 1.00 | 1.00 | 1.00 | 1.00 | 1.00 | 1.00 | 1.00 |
Numerical data
The following are the details of the technical indicators and moving averages that were collected to generate this technical analysis:
| RSI (14): | 46.29 | |
| MACD (12,26,9): | -0.0001 | |
| Directional Movement: | -3.65 | |
| AROON (14): | 28.57 | |
| DEMA (21): | 1.00 | |
| Parabolic SAR (0,02-0,02-0,2): | 1.00 | |
| Elder Ray (13): | 0.00 | |
| Super Trend (3,10): | 1.00 | |
| Zig ZAG (10): | 1.00 | |
| VORTEX (21): | 0.9837 | |
| Stochastique (14,3,5): | 68.47 | |
| TEMA (21): | 1.00 | |
| Williams %R (14): | -35.14 | |
| Chande Momentum Oscillator (20): | 0.00 | |
| Repulse (5,40,3): | -0.0712 | |
| ROCnROLL: | 2 | |
| TRIX (15,9): | -0.0010 | |
| Courbe Coppock: | 0.04 |
| MA7: | 1.00 | |
| MA20: | 1.00 | |
| MA50: | 1.00 | |
| MA100: | 1.00 | |
| MAexp7: | 1.00 | |
| MAexp20: | 1.00 | |
| MAexp50: | 1.00 | |
| MAexp100: | 1.00 | |
| Price / MA7: | -0.02% | |
| Price / MA20: | -0.03% | |
| Price / MA50: | -0.04% | |
| Price / MA100: | -0.07% | |
| Price / MAexp7: | -0.02% | |
| Price / MAexp20: | -0.03% | |
| Price / MAexp50: | -0.04% | |
| Price / MAexp100: | -0.06% |
About author

Online


Add a comment
Comments
0 comments on the analysis TETHER - USDT/USD - Daily