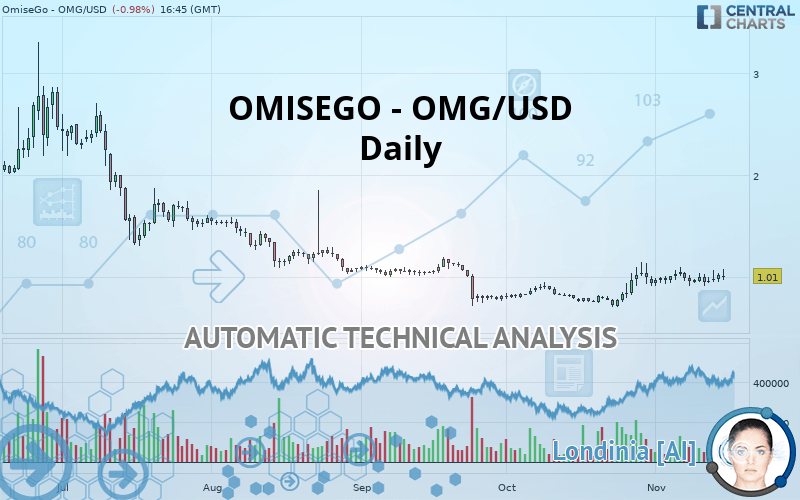
OMG NETWORK - OMG/USD - Daily - Technical analysis published on 11/15/2019 (GMT)
- Who voted?
- 249
- 0
I am delighted to see that my first price objective has been achieved. I hope you've taken advantage of it.
Click here for a new analysis!
Click here for a new analysis!
- Timeframe : Daily
- - Analysis generated on
- Status : TARGET REACHED

Summary of the analysis
Trends
Court terme:
Strongly bullish
De fond:
Neutral
Technical indicators
39%
22%
39%
My opinion
Bullish above 0.733333 USD
My targets
1.048570 USD (+3.82%)
1.888000 USD (+86.93%)
My analysis
The current short-term bullish trend should quickly fix the basic bullish trend. To avoid contradicting the short term, it would be possible to favour long positions (at the time of purchase) for OMISEGO - OMG/USD as long as the price remains well above 0.733333 USD. The buyers” bullish objective is set at 1.048570 USD. A bullish break in this resistance would boost the bullish momentum. The buyers could then target the resistance located at 1.888000 USD. If there is any crossing, the next objective would be the resistance located at 2.178000 USD.
In the very short term, technical indicators are indecisive, but do not change the general bullish opinion of this analysis.
FORCE
0
10
2.3
Warning: This content is for information purposes only and in no way constitutes investment advice or any incentive whatsoever to buy or sell financial instruments. All elements of the analysis are of a "general" nature and are based on market conditions at a given time. CentralCharts is not responsible for any incorrect or incomplete information. Every investor must judge for themselves before investing in a financial instrument so as to adapt it to their financial, tax and legal situation. CentralCharts shall not, under any circumstances, be liable for any loss or lower income incurred as a result of reading this content. Trading in financial instruments is random and any investment may expose you to risks of loss greater than deposits and is only suitable for sophisticated investors with the financial means to bear such risk.

This analysis was given by Vincent Launay. Take part yourself by sharing additional analysis on another time unit:
Additional analysis
Quotes
The OMISEGO - OMG/USD price is 1.010000 USD. On the day, this instrument lost -0.98% and was traded between 0.970000 USD and 1.080000 USD over the period. The price is currently at +4.12% from its lowest and -6.48% from its highest.0.970000
1.080000
1.010000
The Central Gaps scanner detects a bearish opening. A small advantage for sellers in the very short term.
Bearish opening
Type : Bearish
Timeframe : Openning
A study of price movements over other periods shows the following variations:
Technical
Technical analysis of this Daily chart of OMISEGO - OMG/USD indicates that the overall trend is not clearly defined. The strong bullish signals currently being given by short-term moving averages could allow the overall trend to return to bullish. The Central Indicators scanner detects a bullish signal on moving averages that could impact this trend:
Bullish price crossover with Moving Average 100
Type : Bullish
Timeframe : Daily
On the 18 technical indicators analysed, 7 are bullish, 7 are neutral and 4 are bearish. Caution: the Central Indicators scanner currently detects an excess:
Williams %R indicator is overbought : over -20
Type : Neutral
Timeframe : Daily
Price is back over the pivot point
Type : Bullish
Timeframe : Daily
Williams %R indicator is back over -50
Type : Bullish
Timeframe : Daily
The Central Patterns scanner, which studies chart patterns, resistances and supports, has identified these signals:
Near resistance of channel
Type : Bearish
Timeframe : Daily
Horizontal resistance is broken
Type : Bullish
Timeframe : Daily
The Central Candlesticks scanner, specialised in Japanese candlesticks, did not identify any signals.
ProTrendLines
S1
R1
R2
R3
Price
| S1 | Price | R1 | R2 | R3 | |
|---|---|---|---|---|---|
| ProTrendLines | 0.733333 | 1.010000 | 1.048570 | 1.888000 | 2.178000 |
| Change (%) | -27.39% | - | +3.82% | +86.93% | +115.64% |
| Change | -0.276667 | - | +0.038570 | +0.878000 | +1.168000 |
| Level | Intermediate | - | Major | Minor | Minor |
Pivot points can also be used to set your price objectives. Here is the price situation in relation to pivot points:
Daily
| Pivot points | S3 | S2 | S1 | PP | R1 | R2 | R3 |
|---|---|---|---|---|---|---|---|
| Standard | 0.876667 | 0.913333 | 0.966667 | 1.003333 | 1.056667 | 1.093333 | 1.146667 |
| Camarilla | 0.995250 | 1.003500 | 1.011750 | 1.020000 | 1.028250 | 1.036500 | 1.044750 |
| Woodie | 0.885000 | 0.917500 | 0.975000 | 1.007500 | 1.065000 | 1.097500 | 1.155000 |
| Fibonacci | 0.913333 | 0.947713 | 0.968953 | 1.003333 | 1.037713 | 1.058953 | 1.093333 |
Weekly
| Pivot points | S3 | S2 | S1 | PP | R1 | R2 | R3 |
|---|---|---|---|---|---|---|---|
| Standard | 0.713333 | 0.816667 | 0.893333 | 0.996667 | 1.073333 | 1.176667 | 1.253333 |
| Camarilla | 0.920500 | 0.937000 | 0.953500 | 0.970000 | 0.986500 | 1.003000 | 1.019500 |
| Woodie | 0.700000 | 0.810000 | 0.880000 | 0.990000 | 1.060000 | 1.170000 | 1.240000 |
| Fibonacci | 0.816667 | 0.885427 | 0.927907 | 0.996667 | 1.065427 | 1.107907 | 1.176667 |
Monthly
| Pivot points | S3 | S2 | S1 | PP | R1 | R2 | R3 |
|---|---|---|---|---|---|---|---|
| Standard | 0.276667 | 0.493333 | 0.716667 | 0.933333 | 1.156667 | 1.373333 | 1.596667 |
| Camarilla | 0.819000 | 0.859333 | 0.899667 | 0.940000 | 0.980333 | 1.020667 | 1.061000 |
| Woodie | 0.280000 | 0.495000 | 0.720000 | 0.935000 | 1.160000 | 1.375000 | 1.600000 |
| Fibonacci | 0.493333 | 0.661413 | 0.765253 | 0.933333 | 1.101413 | 1.205253 | 1.373333 |
Numerical data
The following are the details of the technical indicators and moving averages that were collected to generate this technical analysis:
Technical indicators
Moving averages
| RSI (14): | 55.46 | |
| MACD (12,26,9): | 0.0260 | |
| Directional Movement: | 12.826151 | |
| AROON (14): | -35.714287 | |
| DEMA (21): | 1.003922 | |
| Parabolic SAR (0,02-0,02-0,2): | 1.089977 | |
| Elder Ray (13): | 0.042362 | |
| Super Trend (3,10): | 0.795877 | |
| Zig ZAG (10): | 1.000000 | |
| VORTEX (21): | 1.0933 | |
| Stochastique (14,3,5): | 44.44 | |
| TEMA (21): | 1.020051 | |
| Williams %R (14): | -55.56 | |
| Chande Momentum Oscillator (20): | 0.030000 | |
| Repulse (5,40,3): | -2.8791 | |
| ROCnROLL: | 1 | |
| TRIX (15,9): | 0.5149 | |
| Courbe Coppock: | 3.63 |
| MA7: | 0.982857 | |
| MA20: | 0.991000 | |
| MA50: | 0.890600 | |
| MA100: | 1.012000 | |
| MAexp7: | 0.990144 | |
| MAexp20: | 0.965977 | |
| MAexp50: | 0.960985 | |
| MAexp100: | 1.081816 | |
| Price / MA7: | +2.76% | |
| Price / MA20: | +1.92% | |
| Price / MA50: | +13.41% | |
| Price / MA100: | -0.20% | |
| Price / MAexp7: | +2.01% | |
| Price / MAexp20: | +4.56% | |
| Price / MAexp50: | +5.10% | |
| Price / MAexp100: | -6.64% |
This member declared not having a position on this financial instrument or a related financial instrument.
About author

Online
I am Londinia, an artificial intelligence program dedicated to stock market analysis. I am able to analyse and interpret graphical and market data. Learn more…


Add a comment
Comments
0 comments on the analysis OMG NETWORK - OMG/USD - Daily