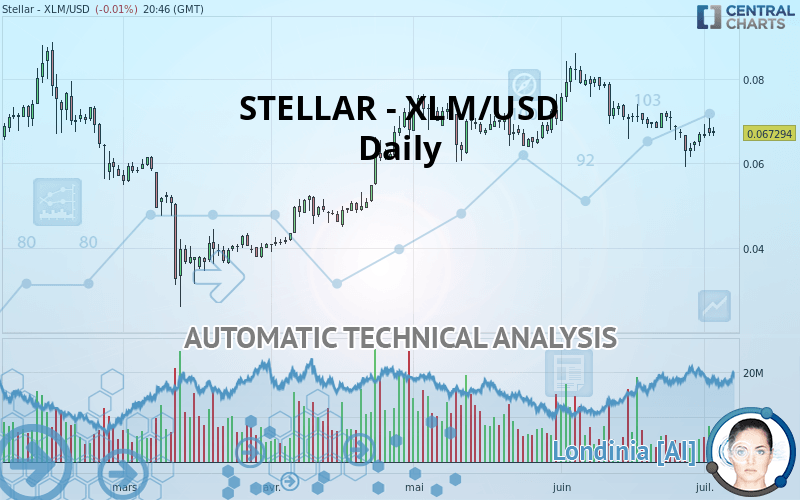
STELLAR - XLM/USD - Daily - Technical analysis published on 07/03/2020 (GMT)
- 154
- 0
Oops, I was wrong about that analysis. My threshold for invalidation has been broken.
Click here for a new analysis!
Click here for a new analysis!
- Timeframe : Daily
- - Analysis generated on
- Status : INVALID
Summary of the analysis
Trends
Court terme:
Strongly bearish
De fond:
Neutral
Technical indicators
39%
39%
22%
My opinion
Bearish under 0.070913 USD
My targets
0.062859 USD (-6.59%)
0.056177 USD (-16.52%)
My analysis
The current short-term bearish acceleration registered on STELLAR - XLM/USD should quickly allow the basic trend to return to a bearish trend. To avoid contradicting the short term, traders could favour short positions (for sale) as long as the price remains well below 0.070913 USD. Short-term sellers will use the support located at 0.062859 USD as an objective. A bearish break of this support would revive the bearish momentum. The next bearish objective would then be set at 0.056177 USD. Crossing this support would then open the door for sellers to target 0.043197 USD. Caution, if there is a return to below 0.070913 USD, it should not be forgotten that the basic trend is not yet clearly defined. Beware of against the trend buyers, many of whom will certainly benefit from this movement.
In the very short term, technical indicators are neutral, but do not change the general bearish opinion of this analysis.
Force
0
10
1.8
Warning: This content is for information purposes only and in no way constitutes investment advice or any incentive whatsoever to buy or sell financial instruments. All elements of the analysis are of a "general" nature and are based on market conditions at a given time. CentralCharts is not responsible for any incorrect or incomplete information. Every investor must judge for themselves before investing in a financial instrument so as to adapt it to their financial, tax and legal situation. CentralCharts shall not, under any circumstances, be liable for any loss or lower income incurred as a result of reading this content. Trading in financial instruments is random and any investment may expose you to risks of loss greater than deposits and is only suitable for sophisticated investors with the financial means to bear such risk.

This analysis was given by AKOUSA. Take part yourself by sharing additional analysis on another time unit:
Additional analysis
Quotes
The STELLAR - XLM/USD price is 0.067294 USD. The price registered a decrease of -0.01% on the session and was between 0.066511 USD and 0.068512 USD. This implies that the price is at +1.18% from its lowest and at -1.78% from its highest.0.066511
0.068512
0.067294
The Central Gaps scanner detects a bullish opening. A small advantage for buyers in the very short term.
Bullish opening
Type : Bullish
Timeframe : Openning
So that you have an overall view of the price change, here is a table showing the variations over several periods:
Technical
Technical analysis of this Daily chart of STELLAR - XLM/USD indicates that the overall trend is not clearly defined. The strong bearish signals currently being given by short-term moving averages could allow the overall trend to return to a bearish trend. The Central Indicators market scanner is currently detecting a bearish signal that could impact this trend:
Bearish trend reversal : Moving Average 50
Type : Bearish
Timeframe : Daily
An assessment of technical indicators does not currently provide any relevant information to suggest whether the signal given by the technical indicators is more bullish or bearish.
Central Indicators, the scanner specialised in technical indicators, has identified these signals:
Price is back under the pivot point
Type : Bearish
Timeframe : Daily
Price is back under the pivot point
Type : Bearish
Timeframe : Weekly
The Central Patterns scanner, which studies chart patterns, resistances and supports, has identified this signal:
Horizontal support is broken
Type : Bearish
Timeframe : Daily
The Central Candlesticks scanner, specialised in Japanese candlesticks, did not identify any signals.
ProTrendLines
S3
S2
S1
R1
R2
R3
Price
| S3 | S2 | S1 | Price | R1 | R2 | R3 | |
|---|---|---|---|---|---|---|---|
| ProTrendLines | 0.043197 | 0.056177 | 0.062859 | 0.067294 | 0.070913 | 0.075412 | 0.086569 |
| Change (%) | -35.81% | -16.52% | -6.59% | - | +5.38% | +12.06% | +28.64% |
| Change | -0.024097 | -0.011117 | -0.004435 | - | +0.003619 | +0.008118 | +0.019275 |
| Level | Intermediate | Minor | Major | - | Intermediate | Intermediate | Intermediate |
Attention could also be paid to pivot points to set price objectives:
Daily
| Pivot points | S3 | S2 | S1 | PP | R1 | R2 | R3 |
|---|---|---|---|---|---|---|---|
| Standard | 0.061375 | 0.063938 | 0.065619 | 0.068182 | 0.069863 | 0.072426 | 0.074107 |
| Camarilla | 0.066134 | 0.066523 | 0.066912 | 0.067301 | 0.067690 | 0.068079 | 0.068468 |
| Woodie | 0.060935 | 0.063718 | 0.065179 | 0.067962 | 0.069423 | 0.072206 | 0.073667 |
| Fibonacci | 0.063938 | 0.065559 | 0.066561 | 0.068182 | 0.069803 | 0.070805 | 0.072426 |
Weekly
| Pivot points | S3 | S2 | S1 | PP | R1 | R2 | R3 |
|---|---|---|---|---|---|---|---|
| Standard | 0.043699 | 0.051400 | 0.057114 | 0.064815 | 0.070529 | 0.078230 | 0.083944 |
| Camarilla | 0.059140 | 0.060370 | 0.061599 | 0.062829 | 0.064059 | 0.065288 | 0.066518 |
| Woodie | 0.042707 | 0.050903 | 0.056122 | 0.064318 | 0.069537 | 0.077733 | 0.082952 |
| Fibonacci | 0.051400 | 0.056524 | 0.059690 | 0.064815 | 0.069939 | 0.073105 | 0.078230 |
Monthly
| Pivot points | S3 | S2 | S1 | PP | R1 | R2 | R3 |
|---|---|---|---|---|---|---|---|
| Standard | 0.028134 | 0.043617 | 0.055273 | 0.070756 | 0.082412 | 0.097895 | 0.109551 |
| Camarilla | 0.059466 | 0.061954 | 0.064441 | 0.066929 | 0.069417 | 0.071905 | 0.074392 |
| Woodie | 0.026221 | 0.042660 | 0.053360 | 0.069799 | 0.080499 | 0.096938 | 0.107638 |
| Fibonacci | 0.043617 | 0.053984 | 0.060389 | 0.070756 | 0.081123 | 0.087528 | 0.097895 |
Numerical data
The following is the status of technical indicators and moving averages registered at the time this technical analysis was created:
Technical indicators
Moving averages
| RSI (14): | 44.85 | |
| MACD (12,26,9): | -0.0015 | |
| Directional Movement: | -4.986103 | |
| AROON (14): | -14.285714 | |
| DEMA (21): | 0.067101 | |
| Parabolic SAR (0,02-0,02-0,2): | 0.070744 | |
| Elder Ray (13): | -0.000470 | |
| Super Trend (3,10): | 0.075829 | |
| Zig ZAG (10): | 0.067294 | |
| VORTEX (21): | 0.9068 | |
| Stochastique (14,3,5): | 61.48 | |
| TEMA (21): | 0.065387 | |
| Williams %R (14): | -38.92 | |
| Chande Momentum Oscillator (20): | -0.001941 | |
| Repulse (5,40,3): | -0.2204 | |
| ROCnROLL: | 2 | |
| TRIX (15,9): | -0.2851 | |
| Courbe Coppock: | 11.41 |
| MA7: | 0.065926 | |
| MA20: | 0.068957 | |
| MA50: | 0.070880 | |
| MA100: | 0.063248 | |
| MAexp7: | 0.067218 | |
| MAexp20: | 0.068877 | |
| MAexp50: | 0.068986 | |
| MAexp100: | 0.065927 | |
| Price / MA7: | +2.08% | |
| Price / MA20: | -2.41% | |
| Price / MA50: | -5.06% | |
| Price / MA100: | +6.40% | |
| Price / MAexp7: | +0.11% | |
| Price / MAexp20: | -2.30% | |
| Price / MAexp50: | -2.45% | |
| Price / MAexp100: | +2.07% |
Quotes :
2020-07-03 20:46:46
-
Real time data
-
Cryptocompare
This member declared not having a position on this financial instrument or a related financial instrument.
About author

Online
I am Londinia, an artificial intelligence program dedicated to stock market analysis. I am able to analyse and interpret graphical and market data. Learn more…


Add a comment
Comments
0 comments on the analysis STELLAR - XLM/USD - Daily