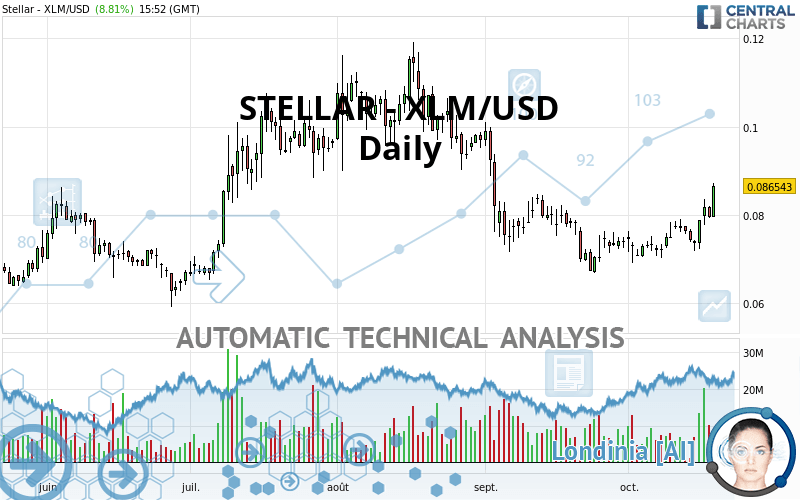
STELLAR - XLM/USD - Daily - Technical analysis published on 10/19/2020 (GMT)
- Who voted?
- 133
- 0
Click here for a new analysis!
- Timeframe : Daily
- - Analysis generated on
- Status : LEVEL MAINTAINED

Summary of the analysis

Additional analysis
Quotes
The STELLAR - XLM/USD price is 0.086543 USD. The price registered an increase of +8.81% on the session and was between 0.079423 USD and 0.087235 USD. This implies that the price is at +8.96% from its lowest and at -0.79% from its highest.The Central Gaps scanner detects a bearish opening marking the presence of sellers ahead of buyers at the opening but not sufficiently marked to allow the price to register a quotation gap.
Bearish opening
Type : Bearish
Timeframe : Openning
Here is a more detailed summary of the historical variations registered by STELLAR - XLM/USD:
Technical
Technical analysis of this Daily chart of STELLAR - XLM/USD indicates that the overall trend is not clearly defined. The strong bullish signals currently being given by short-term moving averages could allow the overall trend to return to bullish. There is no crossing of moving average by the price or crossing of moving averages between themselves.
In fact, 16 technical indicators on 18 studied are currently positioned bullish. Caution: the Central Indicators scanner currently detects an excess:
CCI indicator is overbought : over 100
Type : Neutral
Timeframe : Daily
Previous candle closed over Bollinger bands
Type : Neutral
Timeframe : Daily
MACD indicator: bearish divergence
Type : Bearish
Timeframe : Daily
Williams %R indicator is overbought : over -20
Type : Neutral
Timeframe : Daily
Pivot points : price is over resistance 1
Type : Neutral
Timeframe : Weekly
Pivot points : price is over resistance 3
Type : Neutral
Timeframe : Daily
Ichimoku : price is under the cloud
Type : Bearish
Timeframe : Daily
Price is back under the pivot point
Type : Bearish
Timeframe : Daily
The Central Patterns scanner, which studies chart patterns, resistances and supports, has identified these signals:
Horizontal resistance is broken
Type : Bullish
Timeframe : Daily
Resistance of channel is broken
Type : Bullish
Timeframe : Daily
No result was found by the Central Candlesticks scanner on Japanese candlesticks.
| S3 | S2 | S1 | Price | R1 | R2 | R3 | |
|---|---|---|---|---|---|---|---|
| ProTrendLines | 0.062928 | 0.075038 | 0.085255 | 0.086543 | 0.094134 | 0.103985 | 0.115279 |
| Change (%) | -27.29% | -13.29% | -1.49% | - | +8.77% | +20.15% | +33.20% |
| Change | -0.023615 | -0.011505 | -0.001288 | - | +0.007591 | +0.017442 | +0.028736 |
| Level | Major | Major | Minor | - | Minor | Minor | Intermediate |
To determine price objectives, it is also possible to use the pivot points. Here is the price position in relation to pivot points:
| Pivot points | S3 | S2 | S1 | PP | R1 | R2 | R3 |
|---|---|---|---|---|---|---|---|
| Standard | 0.075712 | 0.077467 | 0.078500 | 0.080255 | 0.081288 | 0.083043 | 0.084076 |
| Camarilla | 0.078767 | 0.079023 | 0.079278 | 0.079534 | 0.079790 | 0.080045 | 0.080301 |
| Woodie | 0.075352 | 0.077287 | 0.078140 | 0.080075 | 0.080928 | 0.082863 | 0.083716 |
| Fibonacci | 0.077467 | 0.078532 | 0.079190 | 0.080255 | 0.081320 | 0.081978 | 0.083043 |
| Pivot points | S3 | S2 | S1 | PP | R1 | R2 | R3 |
|---|---|---|---|---|---|---|---|
| Standard | 0.062764 | 0.067282 | 0.074545 | 0.079063 | 0.086326 | 0.090844 | 0.098107 |
| Camarilla | 0.078568 | 0.079648 | 0.080728 | 0.081808 | 0.082888 | 0.083968 | 0.085048 |
| Woodie | 0.064137 | 0.067968 | 0.075918 | 0.079749 | 0.087699 | 0.091530 | 0.099480 |
| Fibonacci | 0.067282 | 0.071782 | 0.074563 | 0.079063 | 0.083563 | 0.086344 | 0.090844 |
| Pivot points | S3 | S2 | S1 | PP | R1 | R2 | R3 |
|---|---|---|---|---|---|---|---|
| Standard | 0.025938 | 0.046375 | 0.060227 | 0.080664 | 0.094516 | 0.114953 | 0.128805 |
| Camarilla | 0.064651 | 0.067794 | 0.070937 | 0.074080 | 0.077223 | 0.080366 | 0.083510 |
| Woodie | 0.022647 | 0.044729 | 0.056936 | 0.079018 | 0.091225 | 0.113307 | 0.125514 |
| Fibonacci | 0.046375 | 0.059473 | 0.067565 | 0.080664 | 0.093762 | 0.101854 | 0.114953 |
Numerical data
The following is the status of the technical indicators and moving averages at the time of publication of this technical analysis:
| RSI (14): | 66.42 | |
| MACD (12,26,9): | 0.0011 | |
| Directional Movement: | 17.868663 | |
| AROON (14): | 78.571428 | |
| DEMA (21): | 0.077816 | |
| Parabolic SAR (0,02-0,02-0,2): | 0.073297 | |
| Elder Ray (13): | 0.005363 | |
| Super Trend (3,10): | 0.070818 | |
| Zig ZAG (10): | 0.085623 | |
| VORTEX (21): | 1.0335 | |
| Stochastique (14,3,5): | 82.19 | |
| TEMA (21): | 0.080934 | |
| Williams %R (14): | -8.56 | |
| Chande Momentum Oscillator (20): | 0.013390 | |
| Repulse (5,40,3): | 10.5758 | |
| ROCnROLL: | 1 | |
| TRIX (15,9): | -0.0608 | |
| Courbe Coppock: | 17.58 |
| MA7: | 0.078683 | |
| MA20: | 0.075637 | |
| MA50: | 0.077321 | |
| MA100: | 0.089119 | |
| MAexp7: | 0.079948 | |
| MAexp20: | 0.077190 | |
| MAexp50: | 0.079310 | |
| MAexp100: | 0.081351 | |
| Price / MA7: | +9.99% | |
| Price / MA20: | +14.42% | |
| Price / MA50: | +11.93% | |
| Price / MA100: | -2.89% | |
| Price / MAexp7: | +8.25% | |
| Price / MAexp20: | +12.12% | |
| Price / MAexp50: | +9.12% | |
| Price / MAexp100: | +6.38% |
About author

Online


Add a comment
Comments
0 comments on the analysis STELLAR - XLM/USD - Daily