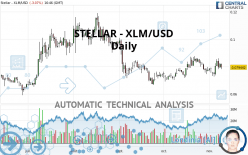
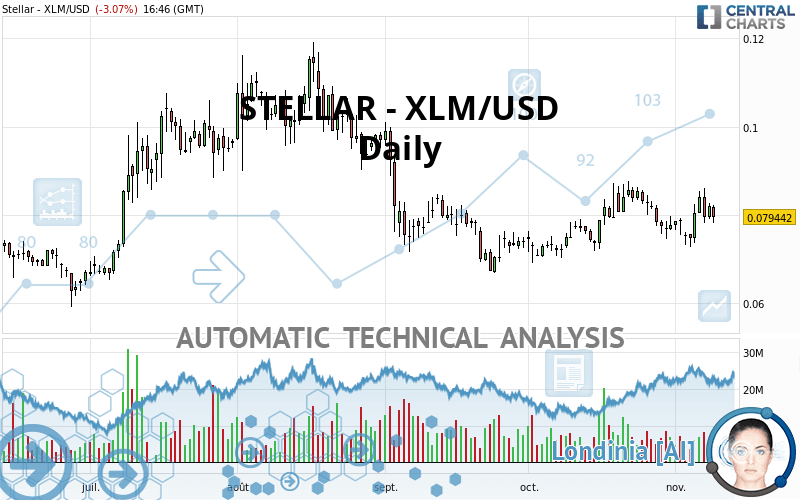
STELLAR - XLM/USD - Daily - Technical analysis published on 11/09/2020 (GMT)
- Who voted?
- 137
- 0
Click here for a new analysis!
- Timeframe : Daily
- - Analysis generated on
- Status : INVALID
Summary of the analysis

Additional analysis
Quotes
STELLAR - XLM/USD rating 0.079442 USD. On the day, this instrument lost -3.07% and was traded between 0.078158 USD and 0.082201 USD over the period. The price is currently at +1.64% from its lowest and -3.36% from its highest.The Central Gaps scanner detects a bearish opening marking the presence of sellers ahead of buyers at the opening but not sufficiently marked to allow the price to register a quotation gap.
Bearish opening
Type : Bearish
Timeframe : Openning
So that you have an overall view of the price change, here is a table showing the variations over several periods:
Technical
A technical analysis in Daily of this STELLAR - XLM/USD chart shows a bearish trend. The signals given by moving averages are at 75.00% bearish. This bearish trend shows slight signs of slowing down given the slightly bearish signals of short-term moving averages. An assessment of moving averages reveals several bullish signals that could impact this trend:
Bullish price crossover with Moving Average 20
Type : Bullish
Timeframe : Daily
Bullish price crossover with adaptative moving average 20
Type : Bullish
Timeframe : Daily
Bullish price crossover with adaptative moving average 50
Type : Bullish
Timeframe : Daily
An assessment of technical indicators does not currently provide any relevant information to suggest whether the signal given by the technical indicators is more bullish or bearish.
Caution: the Central Indicators scanner currently detects an excess:
MACD indicator: bullish divergence
Type : Bullish
Timeframe : Daily
Williams %R indicator is overbought : over -20
Type : Neutral
Timeframe : Daily
Pivot points : price is under support 1
Type : Neutral
Timeframe : Daily
MACD crosses UP its Moving Average
Type : Bullish
Timeframe : Daily
Aroon indicator bullish trend
Type : Bullish
Timeframe : Daily
Price is back over the pivot point
Type : Bullish
Timeframe : Daily
Price is back over the pivot point
Type : Bullish
Timeframe : Weekly
The Central Patterns scanner, which studies chart patterns, resistances and supports, has identified these signals:
Near resistance of channel
Type : Bearish
Timeframe : Daily
Resistance of triangle is broken
Type : Bullish
Timeframe : Daily
Central Candlesticks, the scanner specialised in Japanese candlesticks, detects a bullish signal that could support the hypothesis of a small rebound in the very short term:
Bullish harami
Type : Bullish
Timeframe : Daily
| S3 | S2 | S1 | Price | R1 | R2 | R3 | |
|---|---|---|---|---|---|---|---|
| ProTrendLines | 0.062928 | 0.067162 | 0.075356 | 0.079442 | 0.085030 | 0.094134 | 0.103985 |
| Change (%) | -20.79% | -15.46% | -5.14% | - | +7.03% | +18.49% | +30.89% |
| Change | -0.016514 | -0.012280 | -0.004086 | - | +0.005588 | +0.014692 | +0.024543 |
| Level | Intermediate | Minor | Minor | - | Major | Minor | Minor |
Pivot points can also be used to set your price objectives. Here is the price situation in relation to pivot points:
| Pivot points | S3 | S2 | S1 | PP | R1 | R2 | R3 |
|---|---|---|---|---|---|---|---|
| Standard | 0.075998 | 0.077514 | 0.079738 | 0.081254 | 0.083478 | 0.084994 | 0.087218 |
| Camarilla | 0.080933 | 0.081275 | 0.081618 | 0.081961 | 0.082304 | 0.082647 | 0.082990 |
| Woodie | 0.076351 | 0.077691 | 0.080091 | 0.081431 | 0.083831 | 0.085171 | 0.087571 |
| Fibonacci | 0.077514 | 0.078943 | 0.079826 | 0.081254 | 0.082683 | 0.083566 | 0.084994 |
| Pivot points | S3 | S2 | S1 | PP | R1 | R2 | R3 |
|---|---|---|---|---|---|---|---|
| Standard | 0.059308 | 0.066004 | 0.072752 | 0.079448 | 0.086196 | 0.092892 | 0.099640 |
| Camarilla | 0.075803 | 0.077035 | 0.078268 | 0.079500 | 0.080732 | 0.081965 | 0.083197 |
| Woodie | 0.059334 | 0.066017 | 0.072778 | 0.079461 | 0.086222 | 0.092905 | 0.099666 |
| Fibonacci | 0.066004 | 0.071140 | 0.074312 | 0.079448 | 0.084584 | 0.087756 | 0.092892 |
| Pivot points | S3 | S2 | S1 | PP | R1 | R2 | R3 |
|---|---|---|---|---|---|---|---|
| Standard | 0.049814 | 0.059409 | 0.068576 | 0.078171 | 0.087338 | 0.096933 | 0.106100 |
| Camarilla | 0.072582 | 0.074302 | 0.076022 | 0.077742 | 0.079462 | 0.081182 | 0.082902 |
| Woodie | 0.049599 | 0.059302 | 0.068361 | 0.078064 | 0.087123 | 0.096826 | 0.105885 |
| Fibonacci | 0.059409 | 0.066576 | 0.071004 | 0.078171 | 0.085338 | 0.089766 | 0.096933 |
Numerical data
The following is the status of technical indicators and moving averages registered at the time this technical analysis was created:
| RSI (14): | 49.72 | |
| MACD (12,26,9): | 0.0004 | |
| Directional Movement: | 1.192228 | |
| AROON (14): | 21.428574 | |
| DEMA (21): | 0.080030 | |
| Parabolic SAR (0,02-0,02-0,2): | 0.074713 | |
| Elder Ray (13): | 0.000496 | |
| Super Trend (3,10): | 0.072157 | |
| Zig ZAG (10): | 0.079386 | |
| VORTEX (21): | 0.9463 | |
| Stochastique (14,3,5): | 56.32 | |
| TEMA (21): | 0.080295 | |
| Williams %R (14): | -49.67 | |
| Chande Momentum Oscillator (20): | 0.000999 | |
| Repulse (5,40,3): | -1.0151 | |
| ROCnROLL: | 2 | |
| TRIX (15,9): | 0.0967 | |
| Courbe Coppock: | 6.33 |
| MA7: | 0.079221 | |
| MA20: | 0.080500 | |
| MA50: | 0.076798 | |
| MA100: | 0.085496 | |
| MAexp7: | 0.079695 | |
| MAexp20: | 0.079464 | |
| MAexp50: | 0.079687 | |
| MAexp100: | 0.080824 | |
| Price / MA7: | +0.28% | |
| Price / MA20: | -1.31% | |
| Price / MA50: | +3.44% | |
| Price / MA100: | -7.08% | |
| Price / MAexp7: | -0.32% | |
| Price / MAexp20: | -0.03% | |
| Price / MAexp50: | -0.31% | |
| Price / MAexp100: | -1.71% |
About author

Online


Add a comment
Comments
0 comments on the analysis STELLAR - XLM/USD - Daily