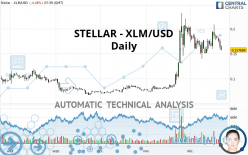
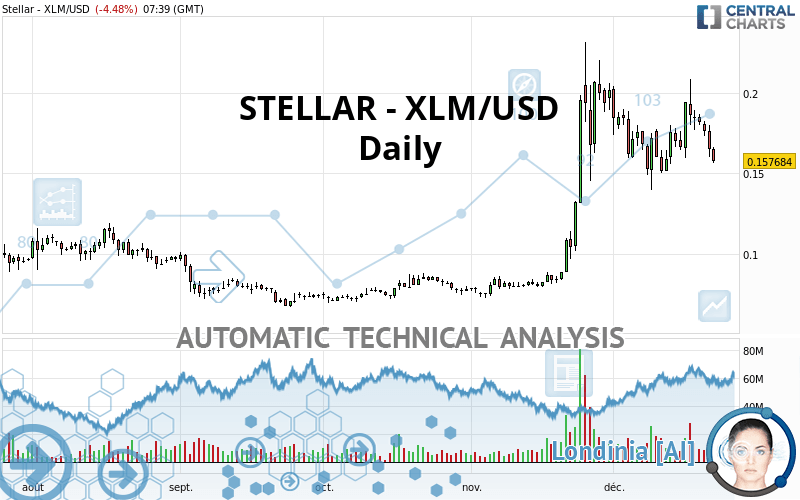
STELLAR - XLM/USD - Daily - Technical analysis published on 12/22/2020 (GMT)
- 158
- 0
Click here for a new analysis!
- Timeframe : Daily
- - Analysis generated on
- Status : INVALID
Summary of the analysis

Additional analysis
Quotes
The STELLAR - XLM/USD rating is 0.157684 USD. On the day, this instrument lost -4.48% with the lowest point at 0.156583 USD and the highest point at 0.166629 USD. The deviation from the price is +0.70% for the low point and -5.37% for the high point.A bullish opening was detected by the Central Gaps scanner. Buyers are trying to impose a bullish momentum in the very short term.
Bullish opening
Type : Bullish
Timeframe : Openning
A study of price movements over other periods shows the following variations:
Technical
Technical analysis of this Daily chart of STELLAR - XLM/USD indicates that the overall trend is bullish. The signals given by moving averages are 71.43% bullish. This bullish trend could slow down given the neutral signals currently being given by short-term moving averages. The Central Indicators market scanner is currently detecting several bearish signals that could impact this trend:
Bearish trend reversal : adaptative moving average 20
Type : Bearish
Timeframe : Daily
Bearish price crossover with Moving Average 20
Type : Bearish
Timeframe : Daily
Bearish price crossover with adaptative moving average 20
Type : Bearish
Timeframe : Daily
Bearish price crossover with adaptative moving average 50
Type : Bearish
Timeframe : Daily
In fact, of the 18 technical indicators analysed by Central Analyzer, 5 are bullish, 6 are neutral and 7 are bearish. Central Indicators, the scanner specialised in technical indicators, has identified these signals:
Ichimoku - Bullish crossover : Tenkan & Kijun
Type : Bullish
Timeframe : Daily
Price is back under the pivot point
Type : Bearish
Timeframe : Daily
Momentum indicator is back under 0
Type : Bearish
Timeframe : Daily
Williams %R indicator is back under -50
Type : Bearish
Timeframe : Daily
The Central Patterns scanner, which studies chart patterns, resistances and supports, has identified this signal:
Near horizontal support
Type : Bullish
Timeframe : Daily
No result was found by the Central Candlesticks scanner on Japanese candlesticks.
| S3 | S2 | S1 | Price | R1 | R2 | R3 | |
|---|---|---|---|---|---|---|---|
| ProTrendLines | 0.099946 | 0.115279 | 0.151312 | 0.157684 | 0.177800 | 0.194183 | 0.206741 |
| Change (%) | -36.62% | -26.89% | -4.04% | - | +12.76% | +23.15% | +31.11% |
| Change | -0.057738 | -0.042405 | -0.006372 | - | +0.020116 | +0.036499 | +0.049057 |
| Level | Minor | Minor | Intermediate | - | Intermediate | Minor | Major |
Attention could also be paid to pivot points to set price objectives:
| Pivot points | S3 | S2 | S1 | PP | R1 | R2 | R3 |
|---|---|---|---|---|---|---|---|
| Standard | 0.136677 | 0.148338 | 0.156711 | 0.168372 | 0.176745 | 0.188406 | 0.196779 |
| Camarilla | 0.159574 | 0.161410 | 0.163247 | 0.165083 | 0.166919 | 0.168756 | 0.170592 |
| Woodie | 0.135032 | 0.147516 | 0.155066 | 0.167550 | 0.175100 | 0.187584 | 0.195134 |
| Fibonacci | 0.148338 | 0.155991 | 0.160719 | 0.168372 | 0.176025 | 0.180753 | 0.188406 |
| Pivot points | S3 | S2 | S1 | PP | R1 | R2 | R3 |
|---|---|---|---|---|---|---|---|
| Standard | 0.102669 | 0.129234 | 0.155506 | 0.182071 | 0.208343 | 0.234908 | 0.261180 |
| Camarilla | 0.167247 | 0.172090 | 0.176934 | 0.181777 | 0.186620 | 0.191464 | 0.196307 |
| Woodie | 0.102522 | 0.129161 | 0.155359 | 0.181998 | 0.208196 | 0.234835 | 0.261033 |
| Fibonacci | 0.129234 | 0.149418 | 0.161888 | 0.182071 | 0.202255 | 0.214725 | 0.234908 |
| Pivot points | S3 | S2 | S1 | PP | R1 | R2 | R3 |
|---|---|---|---|---|---|---|---|
| Standard | -0.053430 | 0.009635 | 0.105716 | 0.168781 | 0.264862 | 0.327927 | 0.424008 |
| Camarilla | 0.158032 | 0.172620 | 0.187209 | 0.201797 | 0.216385 | 0.230974 | 0.245562 |
| Woodie | -0.036922 | 0.017889 | 0.122224 | 0.177035 | 0.281370 | 0.336181 | 0.440516 |
| Fibonacci | 0.009635 | 0.070429 | 0.107987 | 0.168781 | 0.229575 | 0.267133 | 0.327927 |
Numerical data
The following is the status of technical indicators and moving averages registered at the time this technical analysis was created:
| RSI (14): | 47.99 | |
| MACD (12,26,9): | 0.0071 | |
| Directional Movement: | -0.536907 | |
| AROON (14): | 57.142856 | |
| DEMA (21): | 0.181065 | |
| Parabolic SAR (0,02-0,02-0,2): | 0.153371 | |
| Elder Ray (13): | -0.010318 | |
| Super Trend (3,10): | 0.150431 | |
| Zig ZAG (10): | 0.159050 | |
| VORTEX (21): | 0.9517 | |
| Stochastique (14,3,5): | 40.17 | |
| TEMA (21): | 0.174358 | |
| Williams %R (14): | -69.89 | |
| Chande Momentum Oscillator (20): | 0.000029 | |
| Repulse (5,40,3): | -9.9872 | |
| ROCnROLL: | -1 | |
| TRIX (15,9): | 1.0221 | |
| Courbe Coppock: | 8.81 |
| MA7: | 0.178337 | |
| MA20: | 0.170873 | |
| MA50: | 0.139134 | |
| MA100: | 0.107942 | |
| MAexp7: | 0.171326 | |
| MAexp20: | 0.169091 | |
| MAexp50: | 0.147022 | |
| MAexp100: | 0.124202 | |
| Price / MA7: | -11.58% | |
| Price / MA20: | -7.72% | |
| Price / MA50: | +13.33% | |
| Price / MA100: | +46.08% | |
| Price / MAexp7: | -7.96% | |
| Price / MAexp20: | -6.75% | |
| Price / MAexp50: | +7.25% | |
| Price / MAexp100: | +26.96% |
About author

Online


Add a comment
Comments
0 comments on the analysis STELLAR - XLM/USD - Daily